
Somehow, someway, the price of Bitcoin has continued to show resilience after March 12’s capitulation event, decisively retaking $7,300 just minutes ago after trying an failing to surmount this level multiple times over the past few days.
As of the time of this article’s writing, BTC is trading at $7,295, up 8% from the session open and up over 20% since last week’s lows under $5,900.
Bitcoin’s latest bout of strength comes as the stock market has managed to mount a strong comeback, despite the coronavirus outbreak and economic conditions continue to weaken on the weekend, epitomized by the 6.6 million jobless claims in the U.S. alone last week.
What’s Next For Bitcoin?
With the recent price action, which has meant that Bitcoin has almost fully retraced the crash on March 12th, analysts have become increasingly bullish.
Bloomberg wrote last week that Bitcoin’s recent move higher has allowed it to trigger a “positive divergence and a buy signal,” according to the indicator the DVAN Buying and Selling Pressure Gauge. BTC last saw this trend in January, prior to the 50% surge from $7,000 to $10,500. The same indicator also flipped bearish when BTC fell under $10,000 in the middle of February, adding credence to the recent signal.
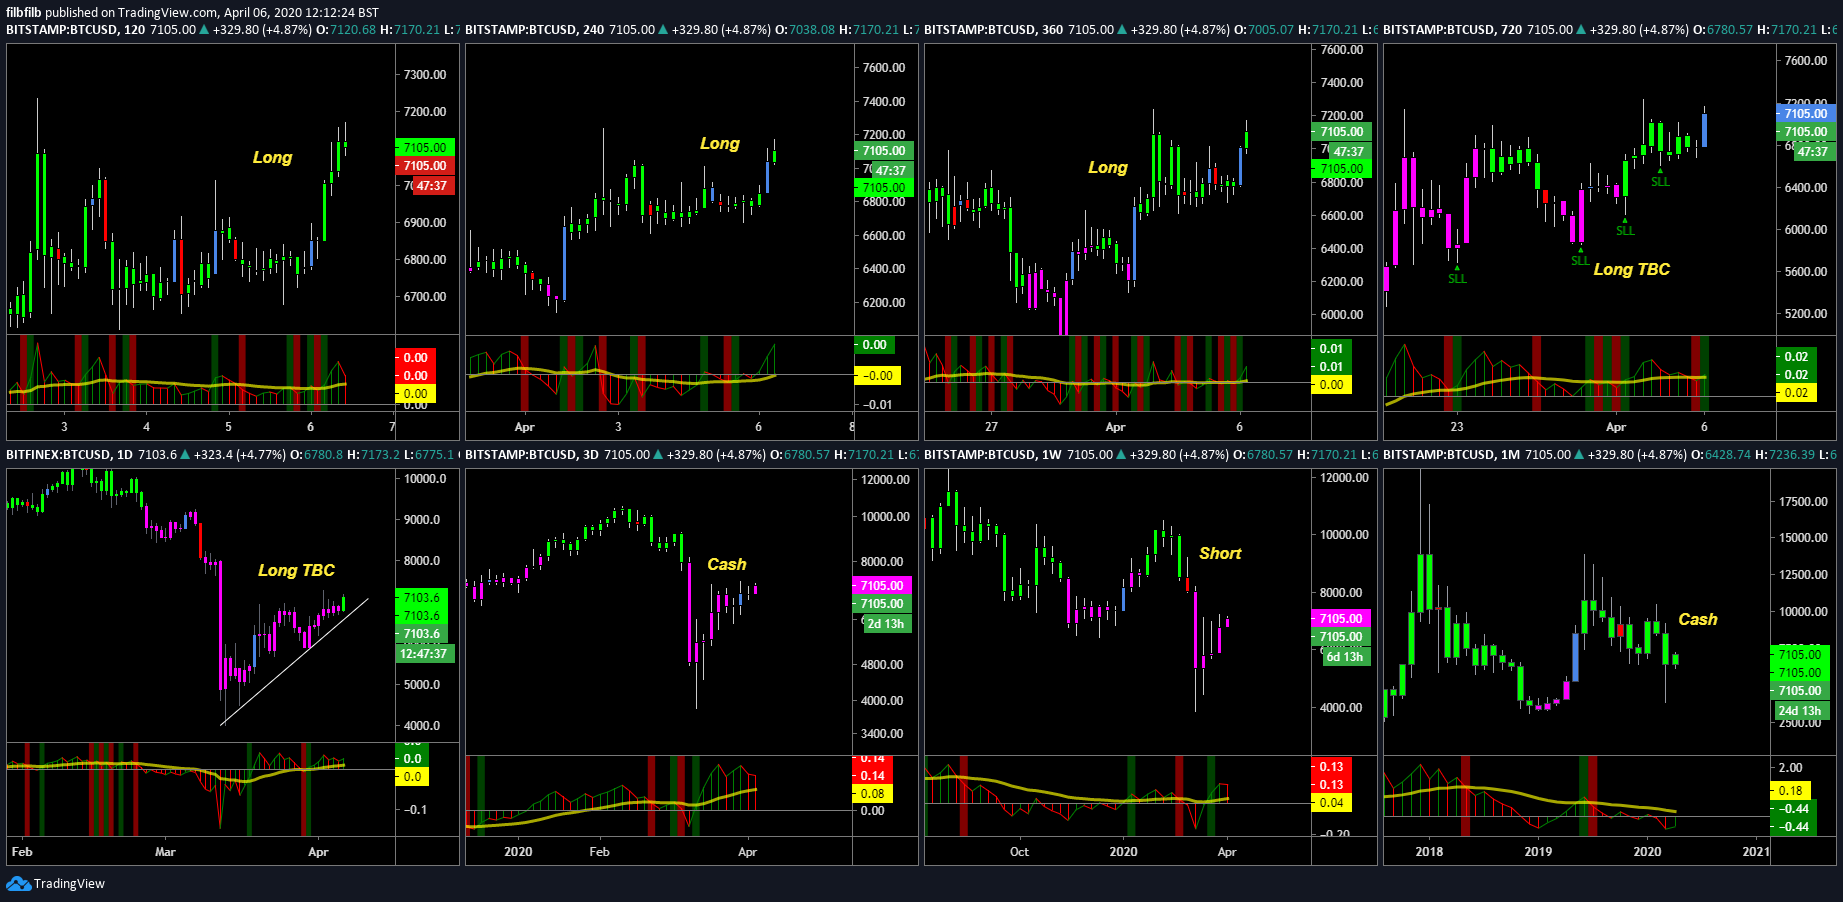
Bitcoin analyst Filb Filb — who accurately predicted the trajectory of BTC (down to the $) in Q4 2019 and January 2020 — wrote in his Telegram channel that his personal indicator suggests “we are good on trend and volume,” adding that a simple technical analysis of the chart implies a rally to $8,150 in the coming days. $8,150 is nearly 15% higher than the current market price.
The optimism has been echoed by others.
Per previous reports from NewsBTC, on-chain analyst Willy Woo found that mining indicators suggest the Bitcoin bottom is in, meaning the cryptocurrency could soon enter back into a bull run.
Woo cited two indicators to convey his point:
- The Hash Ribbons, the moving averages of the Bitcoin network’s hash rate, have started to recover, which is a “reliable” signal of a bottom, the analyst wrote. The last time the Hash Ribbons looked similar to as they do now was in December 2019, at the $6,400 bottom, and in December 2018, the $3,150 bottom.
- The Miners Energy Ratio, “the ratio between Bitcoin’s market cap to its energy consumption, is in the buy zone.” This comes briefly after the metric entered the “extreme buy zone” in mid-March, which was last seen prior to the 4,000% rally from $500 to $20,000.
Featured Image from Shutterstock