Bitcoin price failed to correct above the $55,750 zone against the US Dollar. BTC is showing bearish signs and it remains at a risk of more losses below $54,000.
- Bitcoin failed to correct higher and it struggled to settle above $55,500.
- The price is now trading well below $55,500 and the 100 hourly simple moving average.
- There is a key bearish trend line forming with resistance near $56,000 on the hourly chart of the BTC/USD pair (data feed from Kraken).
- The pair is likely to decline heavily if it fails to stay above $54,000 and $53,750.
Bitcoin Price Signaling Bearish Signs
Yesterday, we saw a crucial decline in bitcoin below the $55,500 support zone. BTC even broke the $54,000 level before starting an upside correction.
There was a recovery above the $55,000 resistance. The price even climbed above $55,500, but there was no follow up move. A high was formed near $55,757 before the price declined again. It broke the $55,000 support zone.
It is now trading well below $55,500 and the 100 hourly simple moving average. There is also a key bearish trend line forming with resistance near $56,000 on the hourly chart of the BTC/USD pair.
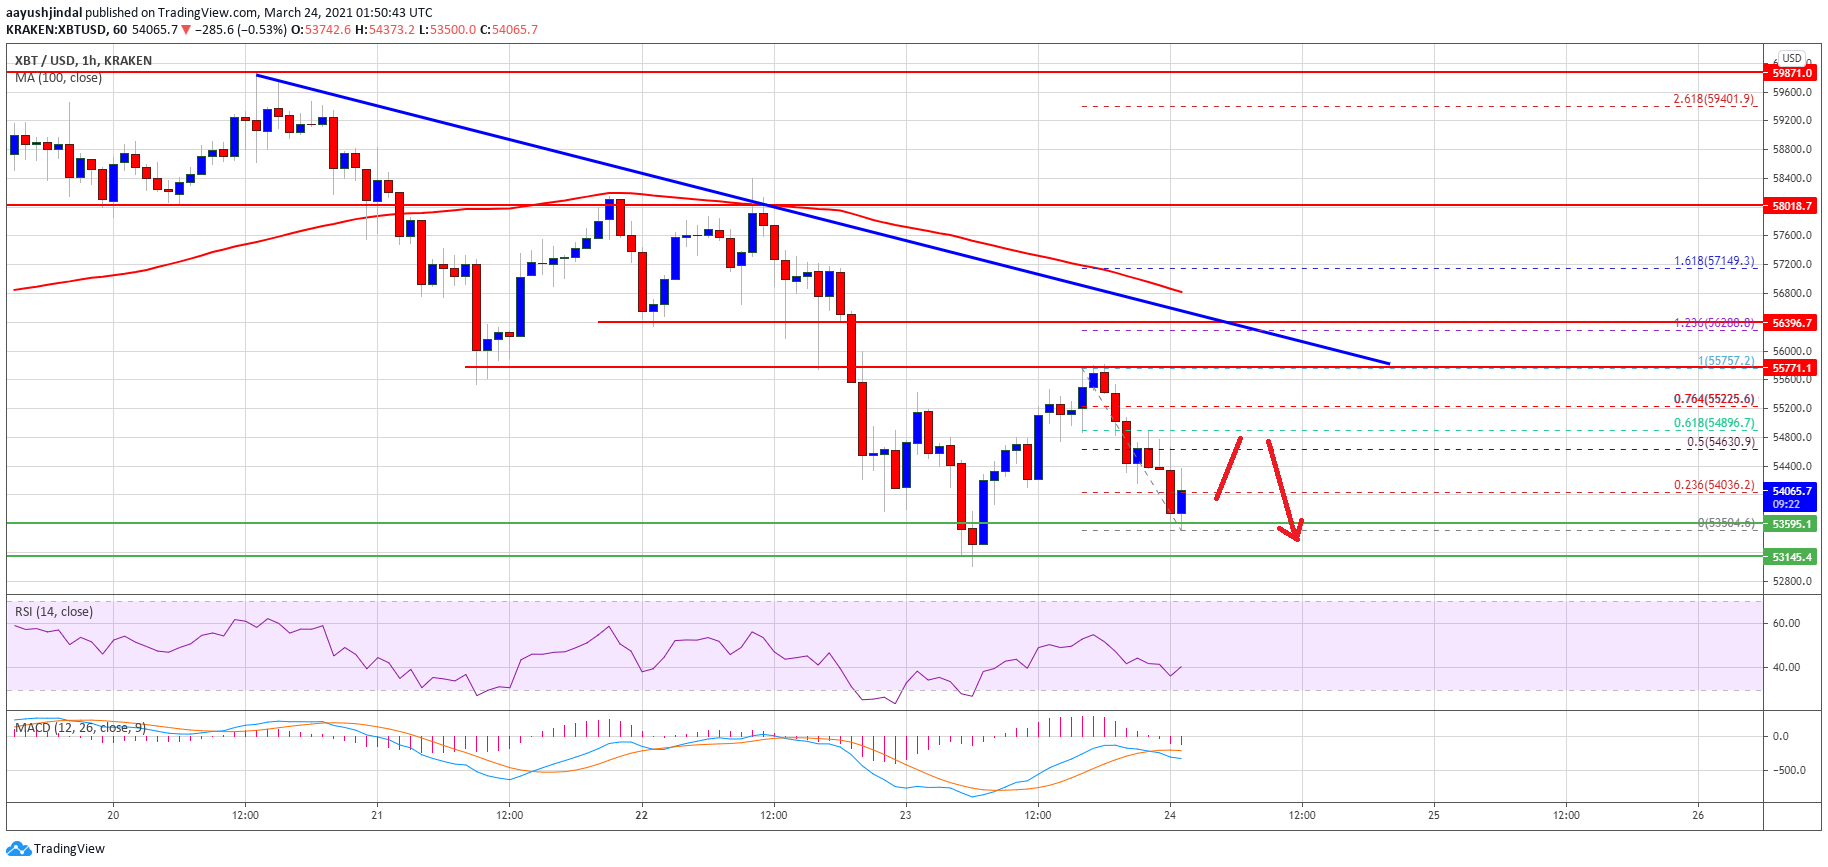
Source: BTCUSD on TradingView.com
An initial resistance on the upside is near the $54,650 level. It is near the 50% Fib retracement level of the recent drop from the $55,757 high to $53,504 low. The first major resistance is near the $54,850 and $55,000 levels.
The 61.8% Fib retracement level of the recent drop from the $55,757 high to $53,504 low is also near $54,850. To start a steady recovery, the price must settle above $55,000 and $55,500. The next major resistance for the bulls could be near the $57,000 region.
More Losses in BTC?
If bitcoin fails to correct higher above $55,000 and $55,500, there are chances of more downsides in the near term. An initial support is near the $54,000 level.
The key support is now near the $53,150 level, below which the bears might aim a test of the $50,000 support zone in the near term.
Technical indicators:
Hourly MACD – The MACD is now gaining momentum in the bearish zone.
Hourly RSI (Relative Strength Index) – The RSI for BTC/USD is now well below the 50 level.
Major Support Levels – $53,000, followed by $51,750.
Major Resistance Levels – $54,850, $55,000 and $55,500.