
Bitcoin (BTC) failed to break $20,000 despite a new weekly high on Oct. 18 as market watchers waited for action.
Bitcoin meanders as stocks climb
Data from Cointelegraph Markets Pro and TradingView showed BTC/USD defying volatility once again on the day.
The pair stayed noticeably stable despite stronger moves for United States equities at the Wall Street open. At the time of writing, the S&P 500 and Nasdaq Composite Index were up 1.5% and 1.2%, respectively.
“We are now witnessing another well overdue relief rally in stocks,” financial commentary resource the Kobeissi Letter told Twitter followers.
“After over a month of near straight-line down price action, a bounce was needed.”
The post continued with a warning over the upcoming meeting of the Federal Reserve at which a further rate hike would be announced.
“However, as Q3 earnings begin and the next Fed meeting approaches, we are far from the clear. Use stops and don’t get trapped,” it advised.
With the mood still uncertain, crypto commentators thus largely stuck to existing predictions when it came to short-term price moves.
“The area around $19.3K is key to hold and then we can expand to $22.2K,” Michaël van de Poppe, founder and CEO of trading platform Eight, wrote in part of a tweet on the day.
Popular trader Il Capo of Crypto declared Bitcoin “ready to pump to 20k+,” having already given a target of $21,000 for the relief rally.
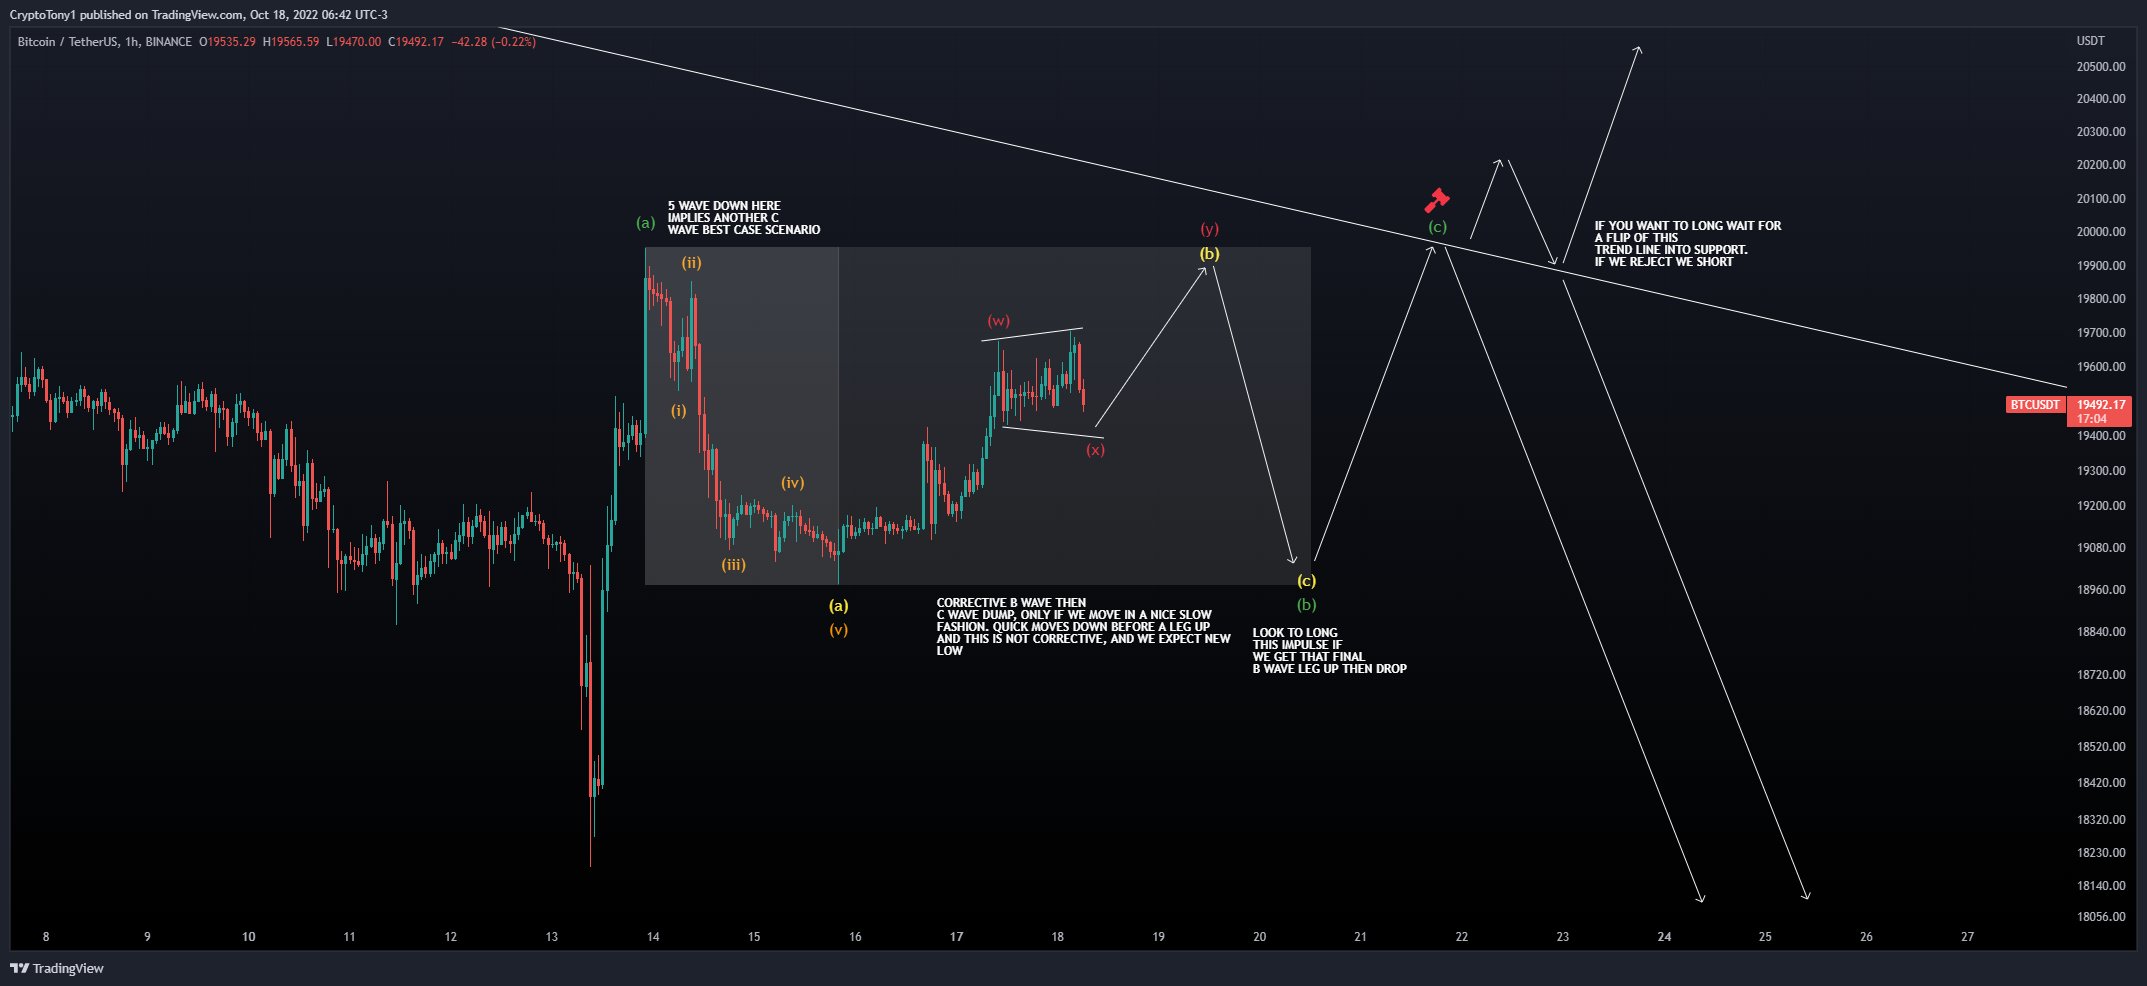
Fellow trader Crypto Tony was more conservative on the potential range for BTC/USD in the coming week, flagging the area around $20,000 as a likely place for a longer-term trajectory decision to be made.
Exchange activity reminiscent of late 2020
The analysis of exchange order books meanwhile produced interesting conclusions about the nature of the current price setup.
Related: Bitcoin price ‘easily’ due to hit $2M in six years — Larry Lepard
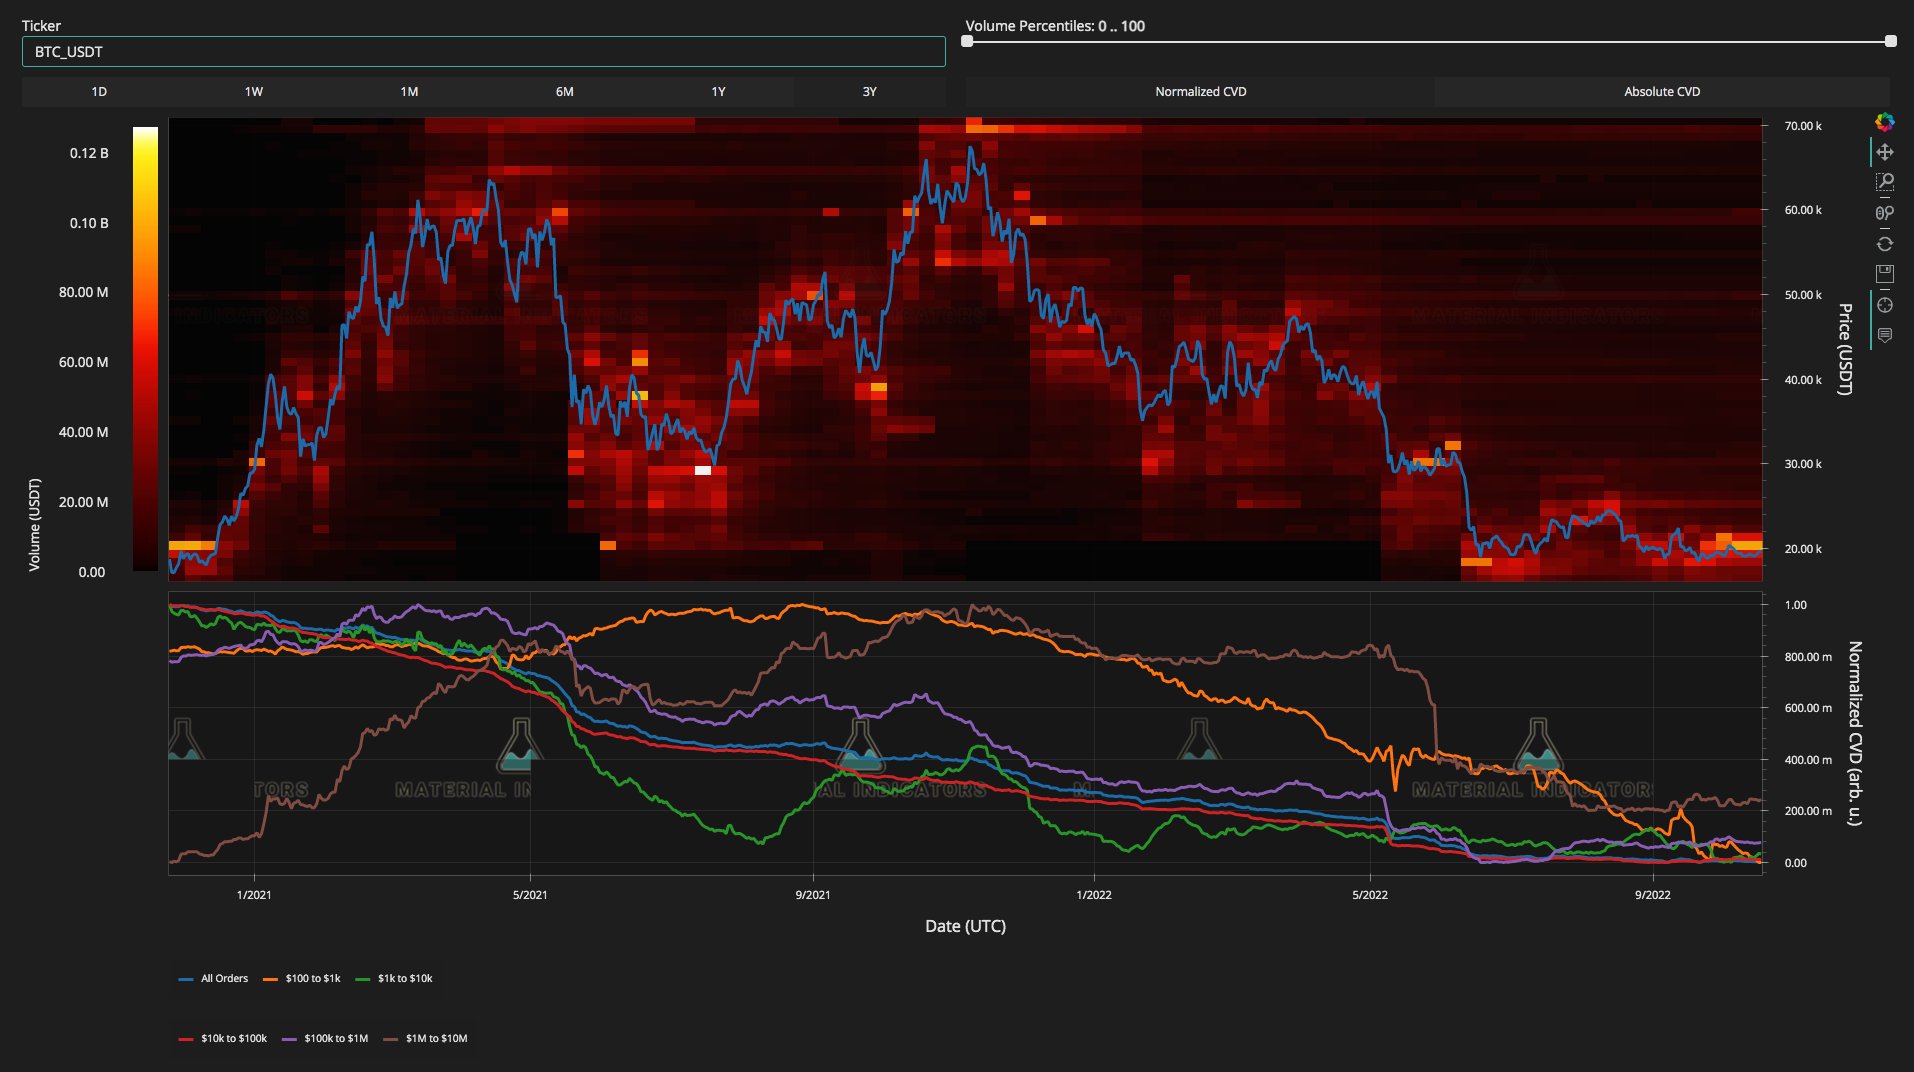
On Binance, the largest exchange by volume, a considerable wall of resistance was active at $20,000, something that on-chain analytics resource Material Indicators likened to November 2020.
At that time, Bitcoin abruptly broke through the $20,000 barrier to begin months of upside to new all-time highs near $60,000.
“The last time BTC had a sell wall this large directly above the active trading range was Nov 2020,” Material Indicators commented.
“It was literally the same amount at the same price level. Over $100M in ask liquidity was eaten to kick off the bull run. Don’t think a breakout from here will do the same, but…”
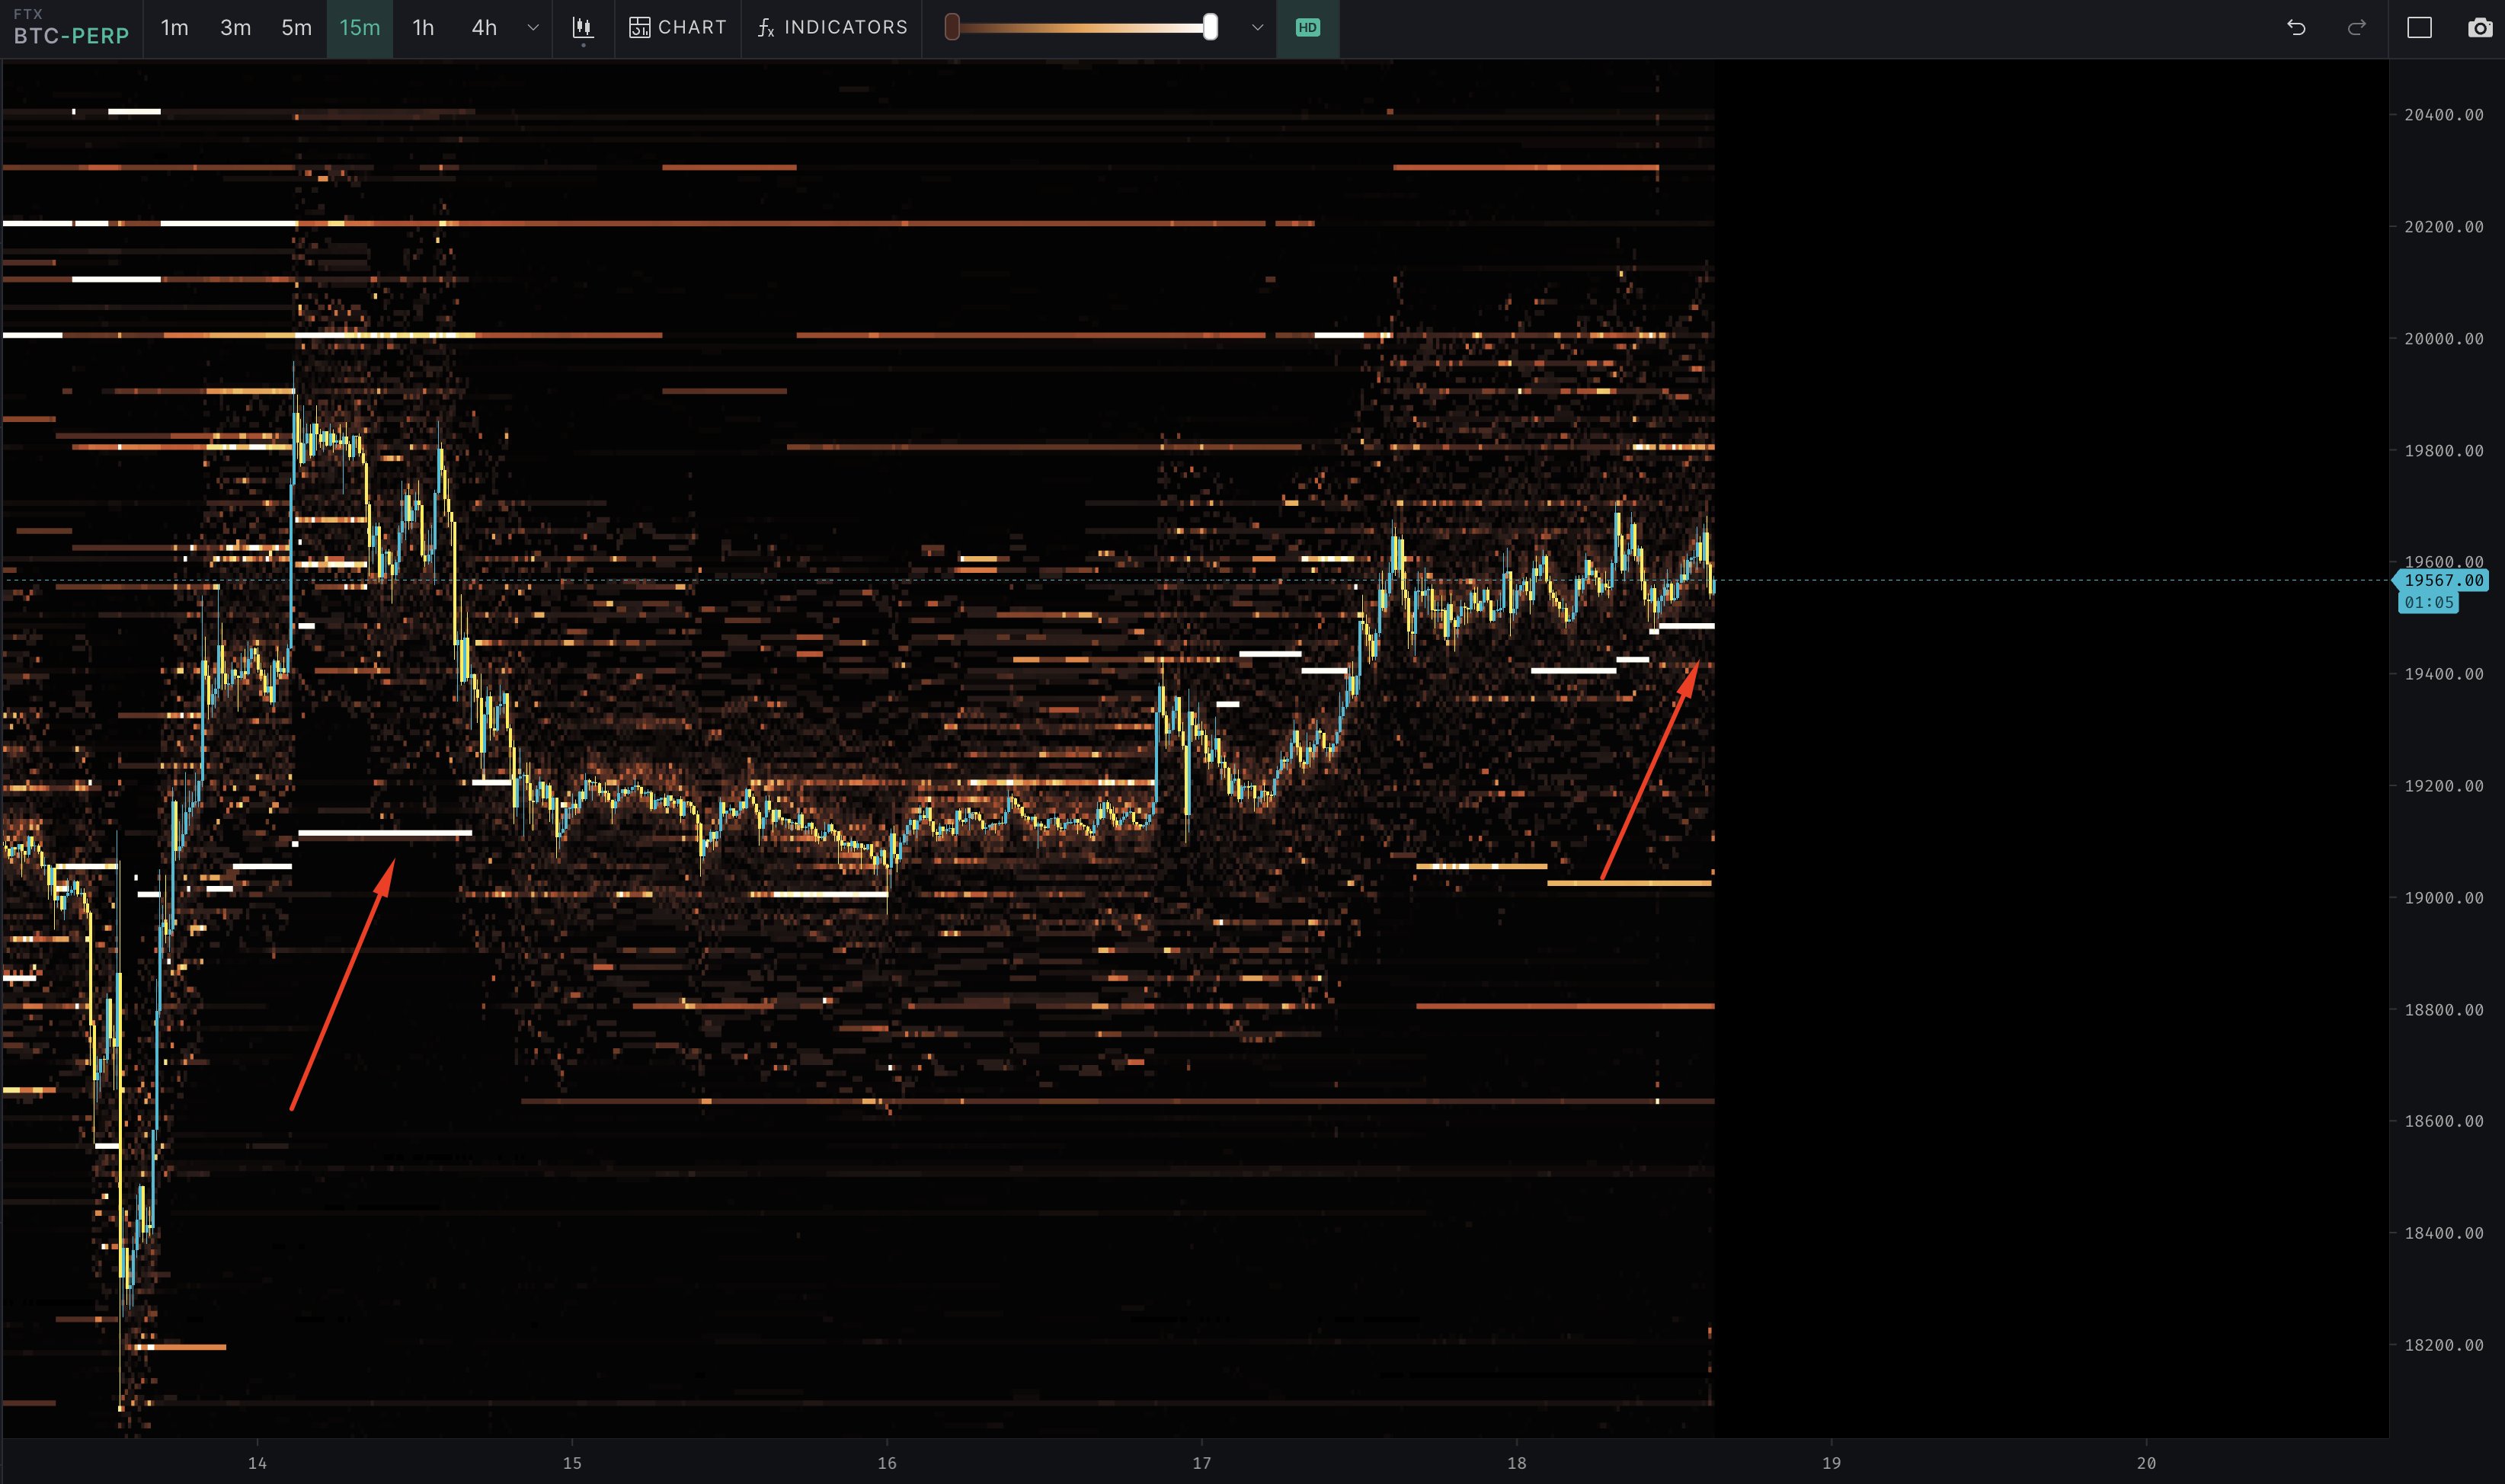
Il Capo of Crypto additionally highlighted activity on the derivatives platform FTX. Traders there had put in strong support, he noted, arguing that this was “pushing the price up.”
The views and opinions expressed here are solely those of the author and do not necessarily reflect the views of Cointelegraph.com. Every investment and trading move involves risk, you should conduct your own research when making a decision.


