
Bitcoin price struggled to clear the $59,500 level. BTC is moving lower and now at risk of more downsides toward the $56,000 level.
- Bitcoin started another decline from the $59,475 resistance zone.
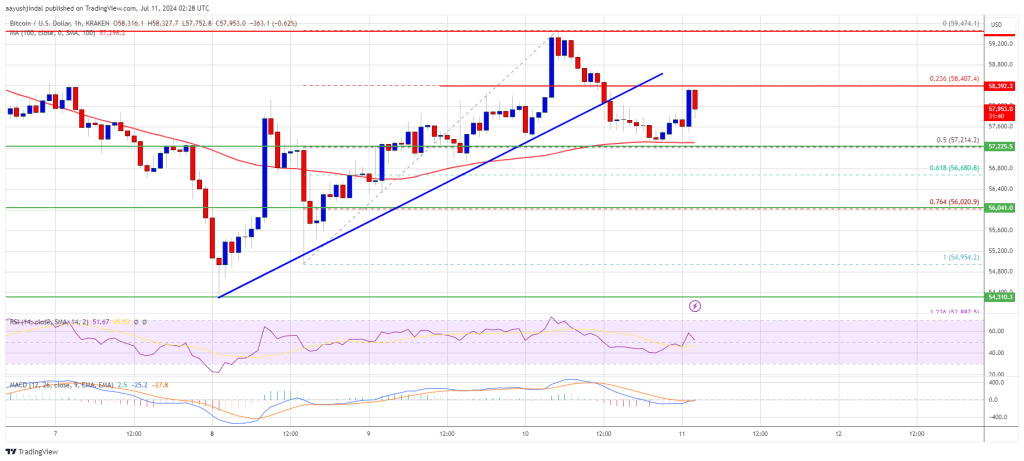
- The price is trading above $57,200 and the 100 hourly Simple moving average.
- There was a break below a key bullish trend line with support at $57,900 on the hourly chart of the BTC/USD pair (data feed from Kraken).
- The pair might start another major decline if it fails to stay above the $57,200 support.
Bitcoin Price Faces Trouble
Bitcoin price extended its recovery wave above the $57,500 level. BTC even climbed above the $58,500 level. However, the bears are active near the $59,500 resistance zone.
A high was formed at $59,474 and the price is now correcting gains. There was a move below the $58,500 level. The price tested the 50% Fib retracement level of the upward move from the $54,955 swing low to the $59,474 high. Besides, there was a break below a key bullish trend line with support at $57,900 on the hourly chart of the BTC/USD pair.
The bulls seem to be active above the $57,200 level. Bitcoin price is now trading above $57,200 and the 100 hourly Simple moving average. Immediate resistance on the upside is near the $58,400 level.
The first key resistance is near the $58,800 level. A clear move above the $58,800 resistance might start a decent increase in the coming sessions. The next key resistance could be $59,500. The next major hurdle sits at $60,000. A close above the $60,000 resistance might start a steady increase and send the price higher. In the stated case, the price could rise and test the $62,500 resistance.
More Losses In BTC?
If Bitcoin fails to climb above the $58,400 resistance zone, it could start another decline. Immediate support on the downside is near the $57,200 level.
The first major support is $56,000 and the 76.4% Fib retracement level of the upward move from the $54,955 swing low to the $59,474 high. The next support is now near $55,000. Any more losses might send the price toward the $53,500 support zone in the near term.
Technical indicators:
Hourly MACD – The MACD is now losing pace in the bullish zone.
Hourly RSI (Relative Strength Index) – The RSI for BTC/USD is now above the 50 level.
Major Support Levels – $57,200, followed by $56,000.
Major Resistance Levels – $58,400, and $59,500.


