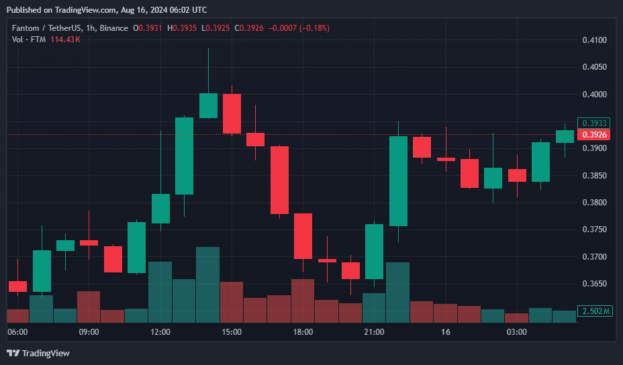
Fantom, a scalable blockchain platform for DeFi, surged by 8% on the morning of Aug. 16, making it the top performer in the crypto market.
At the time of writing, Fantom (FTM) was still up 8%, exchanging hands at $0.393 per price data from crypto.news. The crypto asset’s daily trading volume jumped by 84%, hovering around $274 million, while its market cap stood at $1.1 billion, ranking it 70th among the top largest cryptocurrencies.
The token’s price has jumped by 42% since its drop to $0.276 on Aug. 5, when the crypto and stock markets crashed, leading to over $1 billion in liquidations. Despite its recovery to levels last seen on March 21, FTM is still down 88% from its all-time high of $3.46 recorded in October 2021.
Fantom‘s current price positions it slightly above the middle Bollinger Band at $0.3691 and well below the upper band at $0.4581. The lower band is situated at $0.2801.
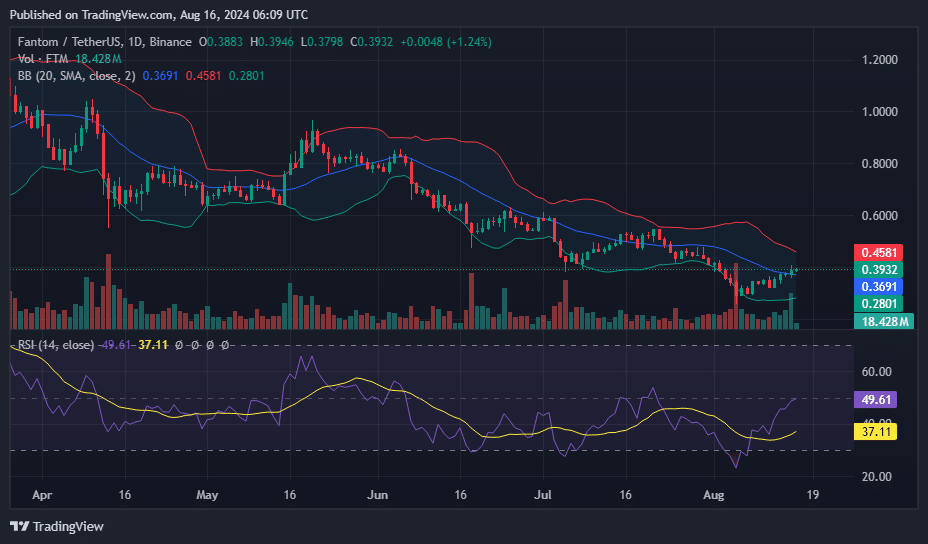
This suggests that FTM is trading within the typical range of its Bollinger Bands, specifically in the upper half of this range. The price being above the middle band but not yet approaching the upper band could indicate that the market sentiment is moderately bullish. However, the token has not yet shown the strength required to challenge the upper resistance level at $0.4581.
FTM consolidates with neutral indicators, awaiting market catalyst
The fact that FTM remains within the Bollinger Bands indicates that the price movement is within expected volatility levels and has not yet reached a point of being overbought or oversold. The proximity to the middle band suggests a phase of consolidation or a mild upward trend but not a strong breakout.
Additionally, the Relative Strength Index is currently at 49.61. This level is close to the neutral 50 mark, indicating neither overbought nor oversold conditions. This further supports the notion that FTM is in a period of consolidation, with the market undecided on the next significant move.
While FTM is displaying mild bullish behavior by trading above the middle Bollinger Band, the lack of a strong push toward the upper band and the neutral RSI suggests that the token is in a state of consolidation.
The market could be waiting for a catalyst to determine the next direction, whether that be upward momentum to test the upper band or a potential retracement back toward the middle or lower bands. A broader analysis of FTM’s price movement on the daily chart also reveals a falling wedge pattern. The price has experienced a significant decline, dropping 78.59% from a high of $1.22 to a low of $0.26 since March 2024.
On a more optimistic note, the price action of FTM suggests the beginning of a bullish phase, as the token has started to rise from the support trendline. Over the last 11 days, FTM has seen a 33.51% increase, pushing it above the 20-day EMA. However, the recent surge in selling pressure around the $0.40 mark led to a sharp price rejection in the most recent intraday candle, raising concerns about a potential bearish reversal.


