
XRP price dropped toward the $0.5550 level before the bulls appeared. The price is now consolidating and might aim for a fresh increase above $0.580.
- XRP price started a consolidation phase after a drop toward the $0.5550 zone.
- The price is now trading below $0.580 and the 100-hourly Simple Moving Average.
- There is a key bearish trend line forming with resistance at $0.5720 on the hourly chart of the XRP/USD pair (data source from Kraken).
- The pair could attempt a recovery wave if it clears the $0.580 resistance zone.
XRP Price Starts Consolidation
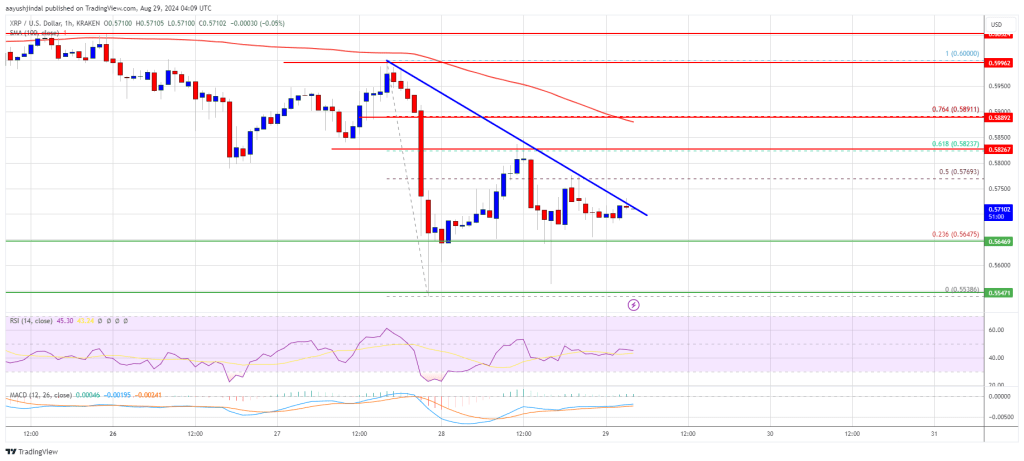
XRP price extended losses below the $0.580 level like Bitcoin and Ethereum. The price even tested the $0.5550 zone. A low was formed at $0.5538 and the price recently started an upside correction.
There was a move above the $0.5580 and $0.5620 levels. The price spiked above the 50% Fib retracement level of the downward move from the $0.60 swing high to the $0.5538 low. However, the bears remained active and protected more upsides above $0.5850.
The price is still trading below $0.580 and the 100-hourly Simple Moving Average. On the upside, the price might face resistance near the $0.5720 level. There is also a key bearish trend line forming with resistance at $0.5720 on the hourly chart of the XRP/USD pair.
The first major resistance is near the $0.5885 level. It is close to the 76.4% Fib retracement level of the downward move from the $0.60 swing high to the $0.5538 low.
The next key resistance could be $0.60. A clear move above the $0.60 resistance might send the price toward the $0.6050 resistance. The next major resistance is near the $0.6160 level. Any more gains might send the price toward the $0.6250 resistance or even $0.6320 in the near term.
Another Decline?
If XRP fails to clear the $0.5720 resistance zone, it could start another decline. Initial support on the downside is near the $0.5640 level. The next major support is at $0.5550.
If there is a downside break and a close below the $0.5550 level, the price might continue to decline toward the $0.5320 support in the near term. The next major support sits at $0.5120.
Technical Indicators
Hourly MACD – The MACD for XRP/USD is now losing pace in the bearish zone.
Hourly RSI (Relative Strength Index) – The RSI for XRP/USD is now below the 50 level.
Major Support Levels – $0.5640 and $0.5550.
Major Resistance Levels – $0.5720 and $0.5885.


