
The Artificial Superintelligence Alliance (FET) has seen a remarkable performance in the last two weeks. Amid the latest market shakeouts, the AI crypto token saw a significant increase, surging over 60% a week ago. In the last 24 hours, the token has recorded a 4% price surge, retesting a crucial resistance level that could propel the price near its all-time high (ATH).
Related Reading
FET Sees 30% Monthly Surge
FET showed a formidable price action throughout August despite the market retraces, seeing a 30% surge in the last 30 days. The ASI alliance token saw a 49% increase in the past two weeks and recovered above pre-Black Monday levels during this timeframe.
Additionally, it saw a massive surge in trading volume, price, and whale activity a week ago when the FET’s on-chain developments fueled the bullish momentum by over 60%. The drive pushed the cryptocurrency’s price to a high of $1.46 on Tuesday, a level not seen since mid-July.
Nonetheless, the market jitters halted FET’s rally, sending the price to a biweekly low of $1.06. The token retested the $1.20 resistance level over the weekend, unsuccessfully reclaiming it but holding above the $1.10 price range.
This performance has been highlighted by several market watchers, who noted that the token has held effectively above the $1.17 support level. This level was retested and maintained since late February when the token’s leg up drove the price to its March ATH of $3.45 but was lost as July closed.
Analysts Suggest Key Levels To Watch
Some market watchers noted that FET recently broke out of crucial horizontal levels. The token has been in a multi-month falling wedge pattern and registered multiple touchpoints within the upper and lower trendlines.
According to Crypto Yapper, some key horizontal levels have come into play in the past month. The token bounced from the “huge” $0.8 support area a few weeks ago. This level was deemed an “interesting accumulation zone” by the analyst.
Since then, FET has seen a significant jump, breaking out of the falling wedge pattern. Following the breakout, it has attempted to turn the next horizontal resistance level into a support zone.
Per the analyst, if the $1.17 level holds strong, the cryptocurrency could move to the next big resistance in the $1.7 area. “Then we can continue the bullish uptrend, and eventually, the top side of the formation will be confluent with the breakout target, which will be around $3.4,” he further explained.
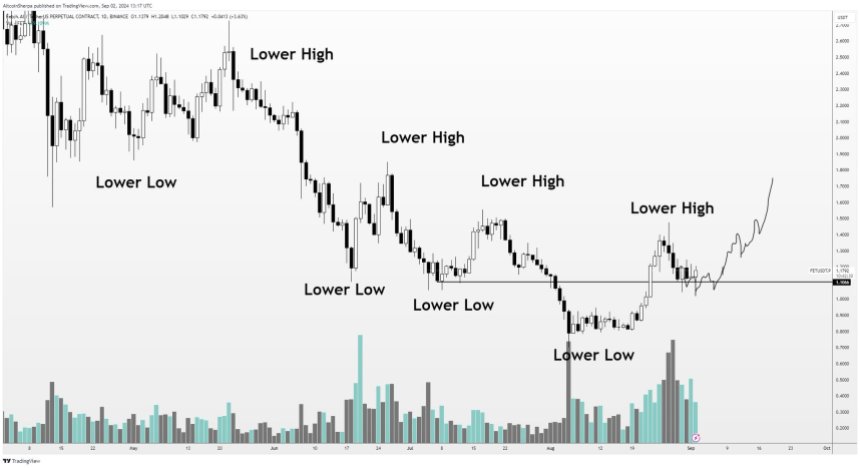
Conversely, other analysts have cautioned that the token remains in a bearish market structure. According to Altcoin Sherpa, FET is attempting to form a higher low, which will need to be followed by a higher high to continue the uptrend.
Related Reading
To Sherpa, if the token achieves this, it will have “bottomed in the short term.” Additionally, he set the $1.5 price zone as a “super key level” for further bullish price action.
FET hovered between the $1.1-$1.21 price range in the last 24 hours, holding above the key support level throughout Monday morning. As of this writing, the token is trading at $1.2, a 4% daily surge.
Featured Image from Unsplash.com, Chart from TradingView.com


