On-chain data shows the Bitcoin Market Value to Realized Value (MVRV) Z-Score is currently giving a bearish signal for the BTC market.
Bitcoin MVRV Z-Score Has Seen A Bearish Crossover Recently
In a new post on X, CryptoQuant author Axel Adler Jr has discussed the latest trend in the Bitcoin MVRV Z-Score. The MVRV Z-Score refers to an indicator that keeps track of the difference between the BTC market cap and realized cap, divided by the standard deviation of the market cap.
The market cap here is naturally just the simple total valuation of the cryptocurrency at the current spot price. The realized cap, however, is an on-chain model that calculates the coin’s capitalization differently.
Instead of taking the current price as the same value for all coins in circulation, it uses the last price at which each coin moved on the blockchain as its value.
Since the last time any coin was transferred was likely the last time it changed hands, the price at its time would denote its current cost basis. Thus, the realized cap is a sum of the cost basis of all circulating tokens.
One way to view this sum is as a measure of the investors’ capital into the cryptocurrency. As the MVRV Z-Score compares the market cap, which is nothing but the amount of capital the investors are holding right now, against this initial investment, it tells us about the investor profitability.
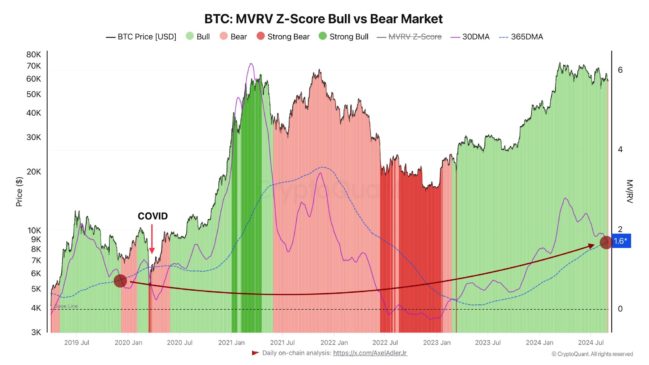
Below is the chart shared by the analyst that shows the trend in the 30-day and 365-day moving averages (MAs) of this Bitcoin indicator over the last few years.
As displayed in the above graph, the 30-day MA of the Bitcoin MVRV Z-Score has been down in recent months, suggesting investor profitability has decreased.
With the latest continuation of the decline, this MA has crossed below the 365-day MA, suggesting the MVRV Z-Score’s average value in the past month has been lower than that for the past year.
In the chart, the CryptoQuant author highlights some zones for the indicator based on the pattern in these two lines. Historically, the 30-day MA sinking below the 365-day has signaled a bearish phase for Bitcoin (colored in light red).
Interestingly, such a bear market signal had also appeared in January 2020, after the market had been cooling down from the 2019 rally. This bearish period was followed by another venture into the bull territory (light green), but the unexpected COVID-19 crash reset the market once more before the bull market kicked off for real.
While it’s possible the latest bear market signal in the MVRV Z-Score could suggest a transition away from a bull market for Bitcoin in the current cycle, it could very well instead go the way the market did in January 2020, with this crossover serving as a healthy reset for a proper bull rally.
BTC Price
At the time of writing, Bitcoin is trading at around $57,700, down more than 6% over the past week.