Data shows three popular Bitcoin momentum indicators recently formed a death cross pattern. Here’s what usually follows this formation.
Bitcoin Momentum Indicators Have Seen Bearish Crossovers Recently
In a new CryptoQuant Quicktake post, an analyst has discussed the latest trend in three momentum indicators related to Bitcoin. The momentum indicators here refer to combinations of some important moving averages (MAs) related to the cryptocurrency.
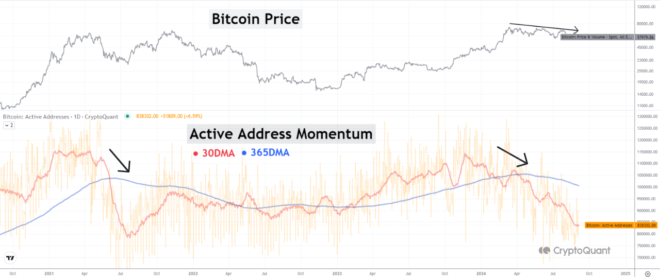
The first is the “Active Address Momentum,” which involves the 30-day and 365-day MAs of the daily unique number of BTC Active Addresses. An address is said to be “active” when it makes some transaction on the network, whether as a receiver or sender.
The number of Active Addresses may be the same as the number of users visiting the network, so this metric tells us how the blockchain activity is looking right now.
Here is the chart shared by the quant that shows the trend in the 30-day and 365-day MAs of the Active Addresses over the last few years.
As displayed in the above graph, the monthly average of the Active Addresses saw a cross under the yearly average shortly after the asset’s rally to the new all-time high (ATH) and has since remained under it.
This crossover implies activity on the BTC blockchain has been on the decline. Generally, user interest keeps rallies fueled, so an increase in Active Addresses is needed to keep any more sustainable.
As investors are starting to pay less attention to the cryptocurrency, conditions may not be right for a bull run anymore. The chart shows that this kind of crossover also occurred at the end of the bull run in the first half of 2021, although the second-half rally did occur regardless.
The second momentum indicator is the famous Market Value to Realized Value (MVRV) Ratio, which tells us whether the investors are in profit or loss.
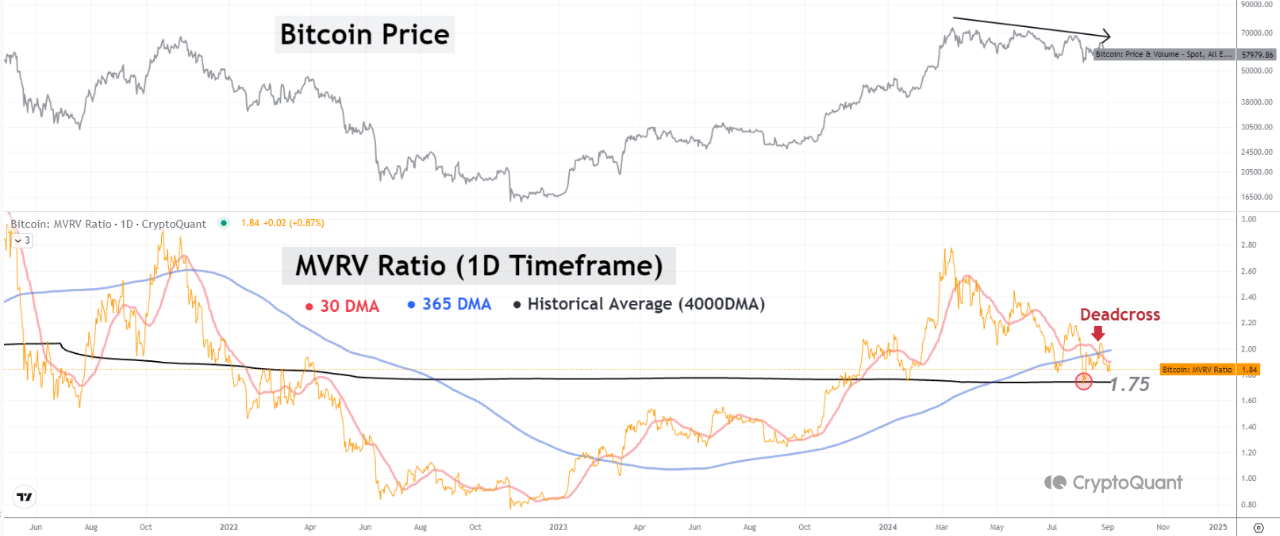
As the chart shows, the MVRV Ratio has also seen its monthly cross below its yearly, suggesting investor profits have been shrinking. This pattern has historically served as a death cross, with BTC shifting towards a bearish phase following it. The same cross also appeared just before the 2022 bear market kicked off.
Finally, there is also the bearish crossover between the 50-day and 200-day MAs of the Bitcoin price itself.
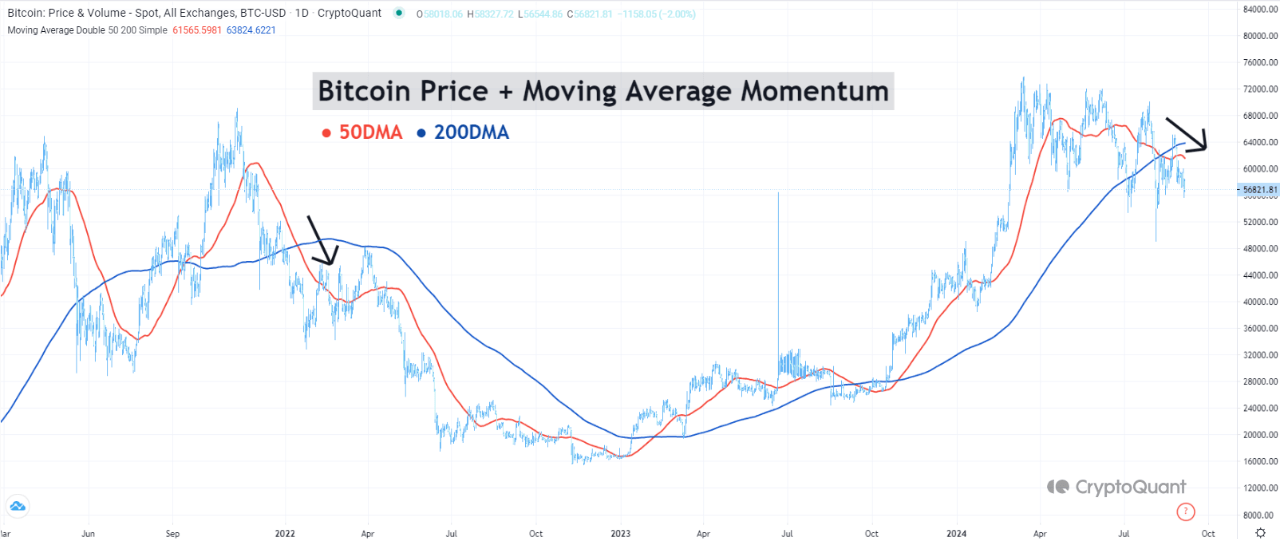
Given all these negative patterns across the different Bitcoin indicators, the cryptocurrency may be heading towards at least a short-term bearish period.
BTC Price
Bitcoin has struggled recently as its price has dipped towards the $56,500 level.


