
Dogecoin (DOGE) is once again at a critical juncture after facing rejection at the $0.09149 level. This pullback has pushed the price toward a key trendline, putting the cryptocurrency in a decisive position.
As Dogecoin tests this crucial support, market watchers are eager to see if the bulls can regroup and trigger a breakout. A successful move above the trendline could open the door for a renewed rally, but failure to hold this level might lead to further downside pressure.
This analysis aims to explore Dogecoin’s current price action following its rejection at the $0.09149 level, which has driven the cryptocurrency back to a critical trendline. By examining key technical indicators and market sentiment, we aim to assess whether the bulls have the potential to ignite a breakout above this trendline or if bearish forces will continue to dominate, pushing the price further down.
Bullish Or Bearish? Analyzing Market Sentiment On DOGE
On the 4-hour chart, following the rejection at $0.09149, Dogecoin has gained momentum, recently crossing above the 100-day Simple Moving Average (SMA) and approaching the bearish trendline. The price action suggests growing positive pressure and market sentiment, which could pave the way for a potential breakout if the trendline is breached.
Also, the Composite Trend Oscillator on the 4-hour chart suggests that bullish momentum is increasing and that a potential breakout above the bearish trendline could be on the horizon as both the signal line and the RSI line of the indicator have moved above the zero mark.
Related Reading
On the 1-day chart, Dogecoin is showing increasing upward momentum as it seeks to break above the bearish trendline and approach the 100-day simple moving average. Specifically, the positive movement reflects growing market optimism, suggesting that if DOGE successfully surpasses the trendline, it could lead to more gains.
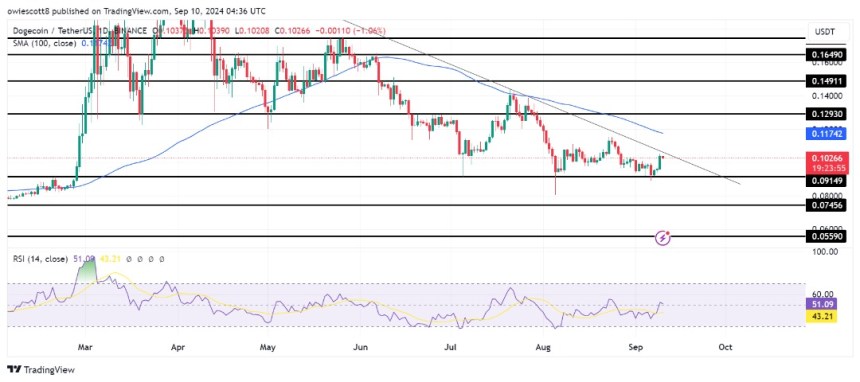
Finally, on the 1-day chart, the signal line has crossed above the SMA line of the composite trend oscillator, and both are moving out of the oversold zone toward the zero line. This implies that momentum is shifting positively, indicating a potential recovery and strengthening bullish outlook as the indicator seeks to exit the oversold conditions.
Key Trendline In Focus: Will Dogecoin Hold Or Fold?
If Dogecoin can break through and hold above this trendline, it may signal a bullish continuation, potentially leading to gains toward $0.1293. A successful breach of this level could pave the way for further increases, with the price possibly testing the $0.1491 mark and exploring even higher resistance zones.
Related Reading
However, should Dogecoin fail to maintain its position above this level, it might drop to the $0.09149 support range. A break below this support could lead to additional declines, with the price potentially testing the $0.07456 mark and reaching other lower support ranges.
Dogecoin, with a market capitalization of over $15 billion and a trading volume exceeding $659 million, was trading around $0.103, marking a 6.49% rise at the time of writing. In the past 24 hours, its market cap has surged by 6.50%, while trading volume has skyrocketed by 52.84%, reflecting renewed interest and bullish momentum in the market.

Featured image from Unsplash, chart from Tradingview.com


