
Bitcoin Cash (BCH) is bracing for a potential downturn after a brief rebound from a trendline failed to ignite bullish momentum. Instead, the cryptocurrency now faces a bearish extension, with its sights set on the key support level at $288. As sellers regain control, the market is on high alert, wondering if this renewed downward pressure will drive BCH even lower or if a bounce-back is still possible.
This article explores Bitcoin Cash’s recent bearish extension following its failure to break above the trendline. It will analyze key technical indicators, examine the market sentiment, and assess the potential for further downside movement toward the critical $288 support level. Additionally, the article will consider whether BCH can find stability amid growing selling pressure or if a deeper decline is on the horizon.
Bearish Extension In Play: Bitcoin Cash Path To The $288 Level
On the 4-hour chart, BCH shows notable bearish momentum as it approaches the 100-day Simple Moving Average (SMA). The failure to overcome this critical trendline indicates that the pressure is intensifying, with sellers increasingly taking charge. This renewed downward force raises the likelihood of further declines, potentially driving the price toward the $288 support level.
Additionally, the Relative Strength Index (RSI) on the 4-hour chart has recently dropped toward the 50% threshold. This decline suggests a waning bullish momentum and indicates that the market may be shifting towards a negative sentiment, reinforcing the potential for more declines in BCH’s price.
Related Reading
On the 1-day chart, BCH is exhibiting a bearish trajectory toward the $288 support level, following a rejection at the trendline. The pessimistic outlook is highlighted by the formation of two consecutive bearish candlesticks. Also, the fact that the price remains below the 100-day SMA reinforces the prevailing negative market sentiment and indicates that the downward pressure may persist, which could drive the price downward.
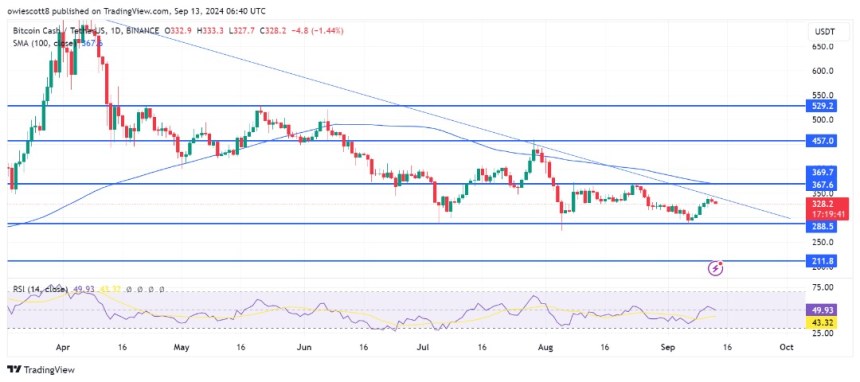
Lastly, on the 1-day chart, the RSI signal line, which recently rose to 54%, is now testing the 50% threshold once more, suggesting that upbeat momentum may be waning and that the market could be transitioning back to a bearish phase. If the RSI falls below the 50% level, it would confirm a shift in sentiment towards selling pressure, potentially supporting the continued downward trend in BCH’s price.
BCH’s New Challenge: Navigating The Bearish Path
Bitcoin Cash (BCH) is facing notable downbeat pressure as it moves toward the $288 support level. Should the bearish pressure continue and the price breach this support, the crypto asset could see further declines, possibly dropping to the $211 support level and exploring additional key support zones beyond that.
Related Reading
Conversely, if BCH manages to hold above the critical support level, it could signal a potential recovery and push toward the $367 resistance mark. A breakout above this level might propel the price higher, possibly testing the $457 resistance and extending to other significant resistance areas.
At the time of writing, Bitcoin Cash was trading at approximately $329, reflecting a 2.71% decline. With a market capitalization surpassing $6.5 billion and a trading volume exceeding $158 million, BCH has seen a decrease of 2.78% in its market cap and a 23.14% drop in trading volume over the past 24 hours.

Featured image from Unsplash, chart from Tradingview.com


