
Key takeaways:
-
Ethereum is breaking out across multiple bullish setups on the price chart.
-
Analysts see ETH rising to $6,000 soon, with $20,000 possible within a year.
Ethereum’s native token, Ether (ETH), has surged roughly 24% this week to above $4,330, its highest price since December 2021. Many analysts now eye a break above the record $4,950 level next.
Ether’s Wyckoff pattern breakout targets $6,000
Ethereum is showing signals of breaking out of its prevailing Wyckoff Accumulation pattern, according to analyst Lord Hawkins.
The ETH/USD pair has been trading inside a large accumulation range for months, steadily absorbing selling pressure. This phase often ends with a decisive breakout once buyers gain control, according to Wyckoff theory.
That breakout appears to be underway, with ETH pushing above the $4,200 resistance zone, a stage known as the “Sign of Strength” (SOS).
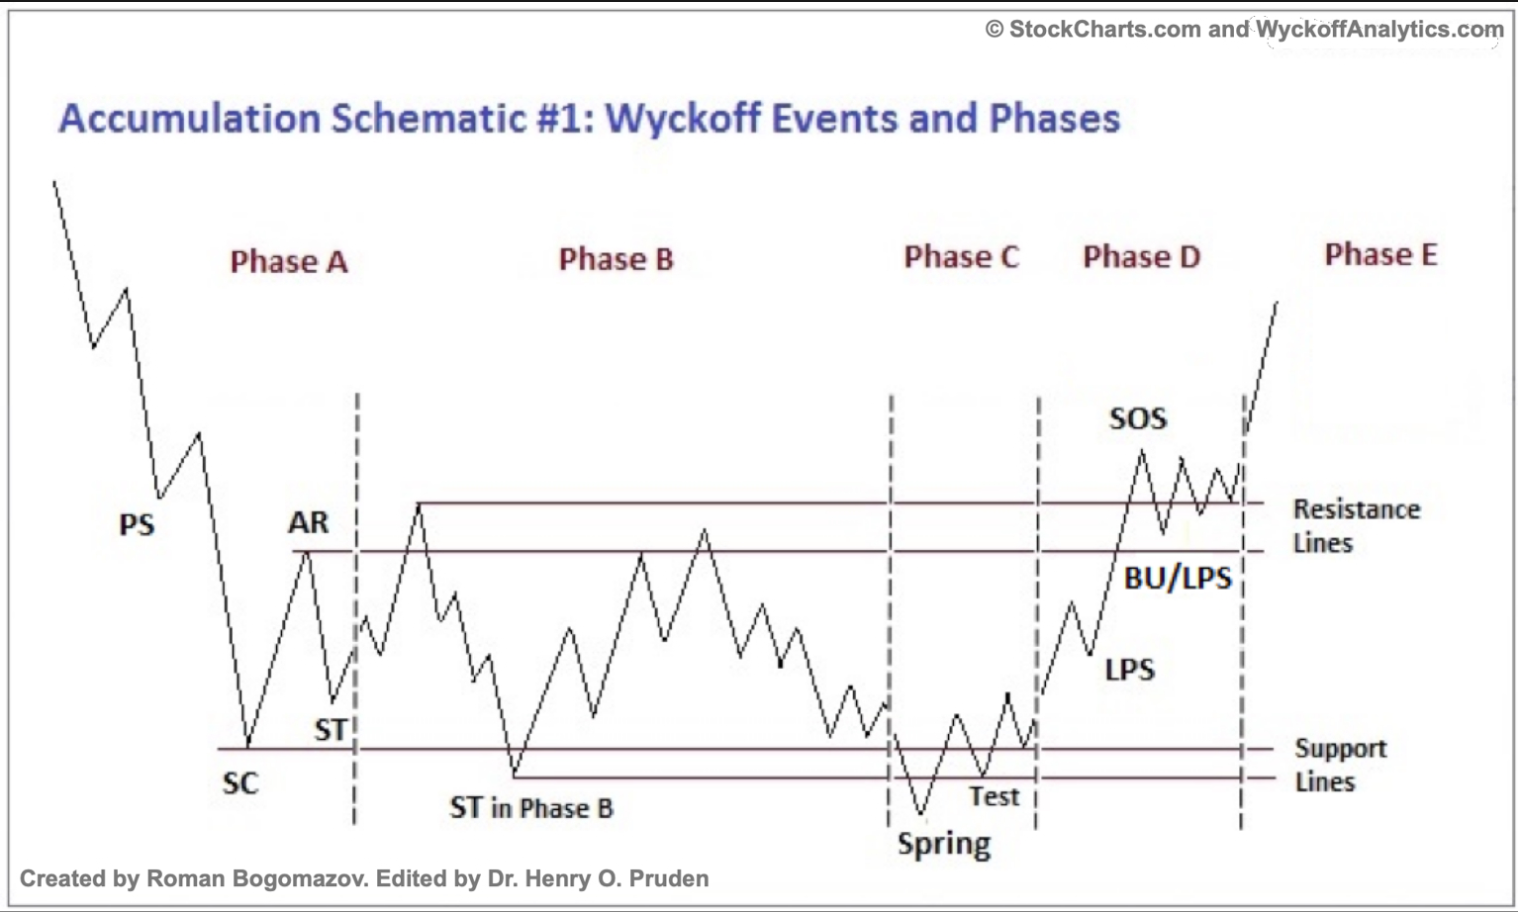
In Wyckoff’s model, this is typically followed by a brief pullback, or “Last Point of Support” (LPS), to confirm the new uptrend.
If the LPS holds, price enters the markup phase, where gains accelerate as demand overwhelms supply. Measuring the height of the accumulation range gives a technical target near $6,000.
Triangle setup shows $8,000 Ether price target
As of Sunday, ETH was breaking above the upper trendline of its multi-year symmetrical triangle, located in the $4,000–$4,200 zone, according to analysts Crypto Rover and Titan of Crypto.
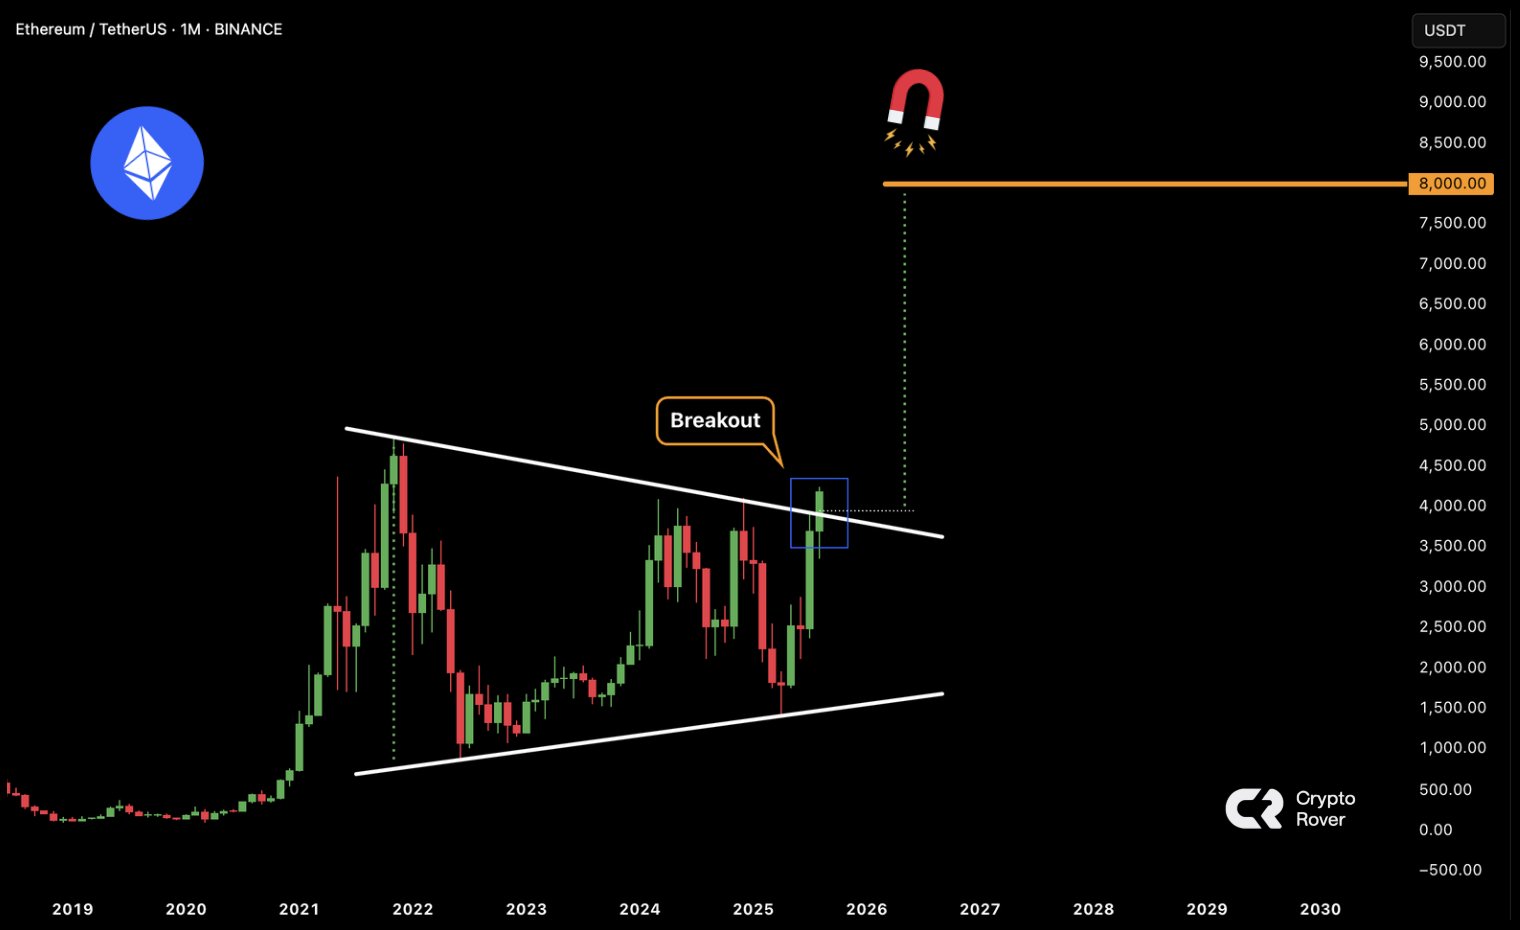
The breakout suggests a potential measured move equal to the triangle’s maximum height, pointing toward the $8,000 region in the coming months. That is up by over 90% from the current price levels.
Historically, such long-term breakouts on ETH’s higher timeframes have preceded strong multimonth rallies, especially when confirmed by increasing volume and favorable macro sentiment.
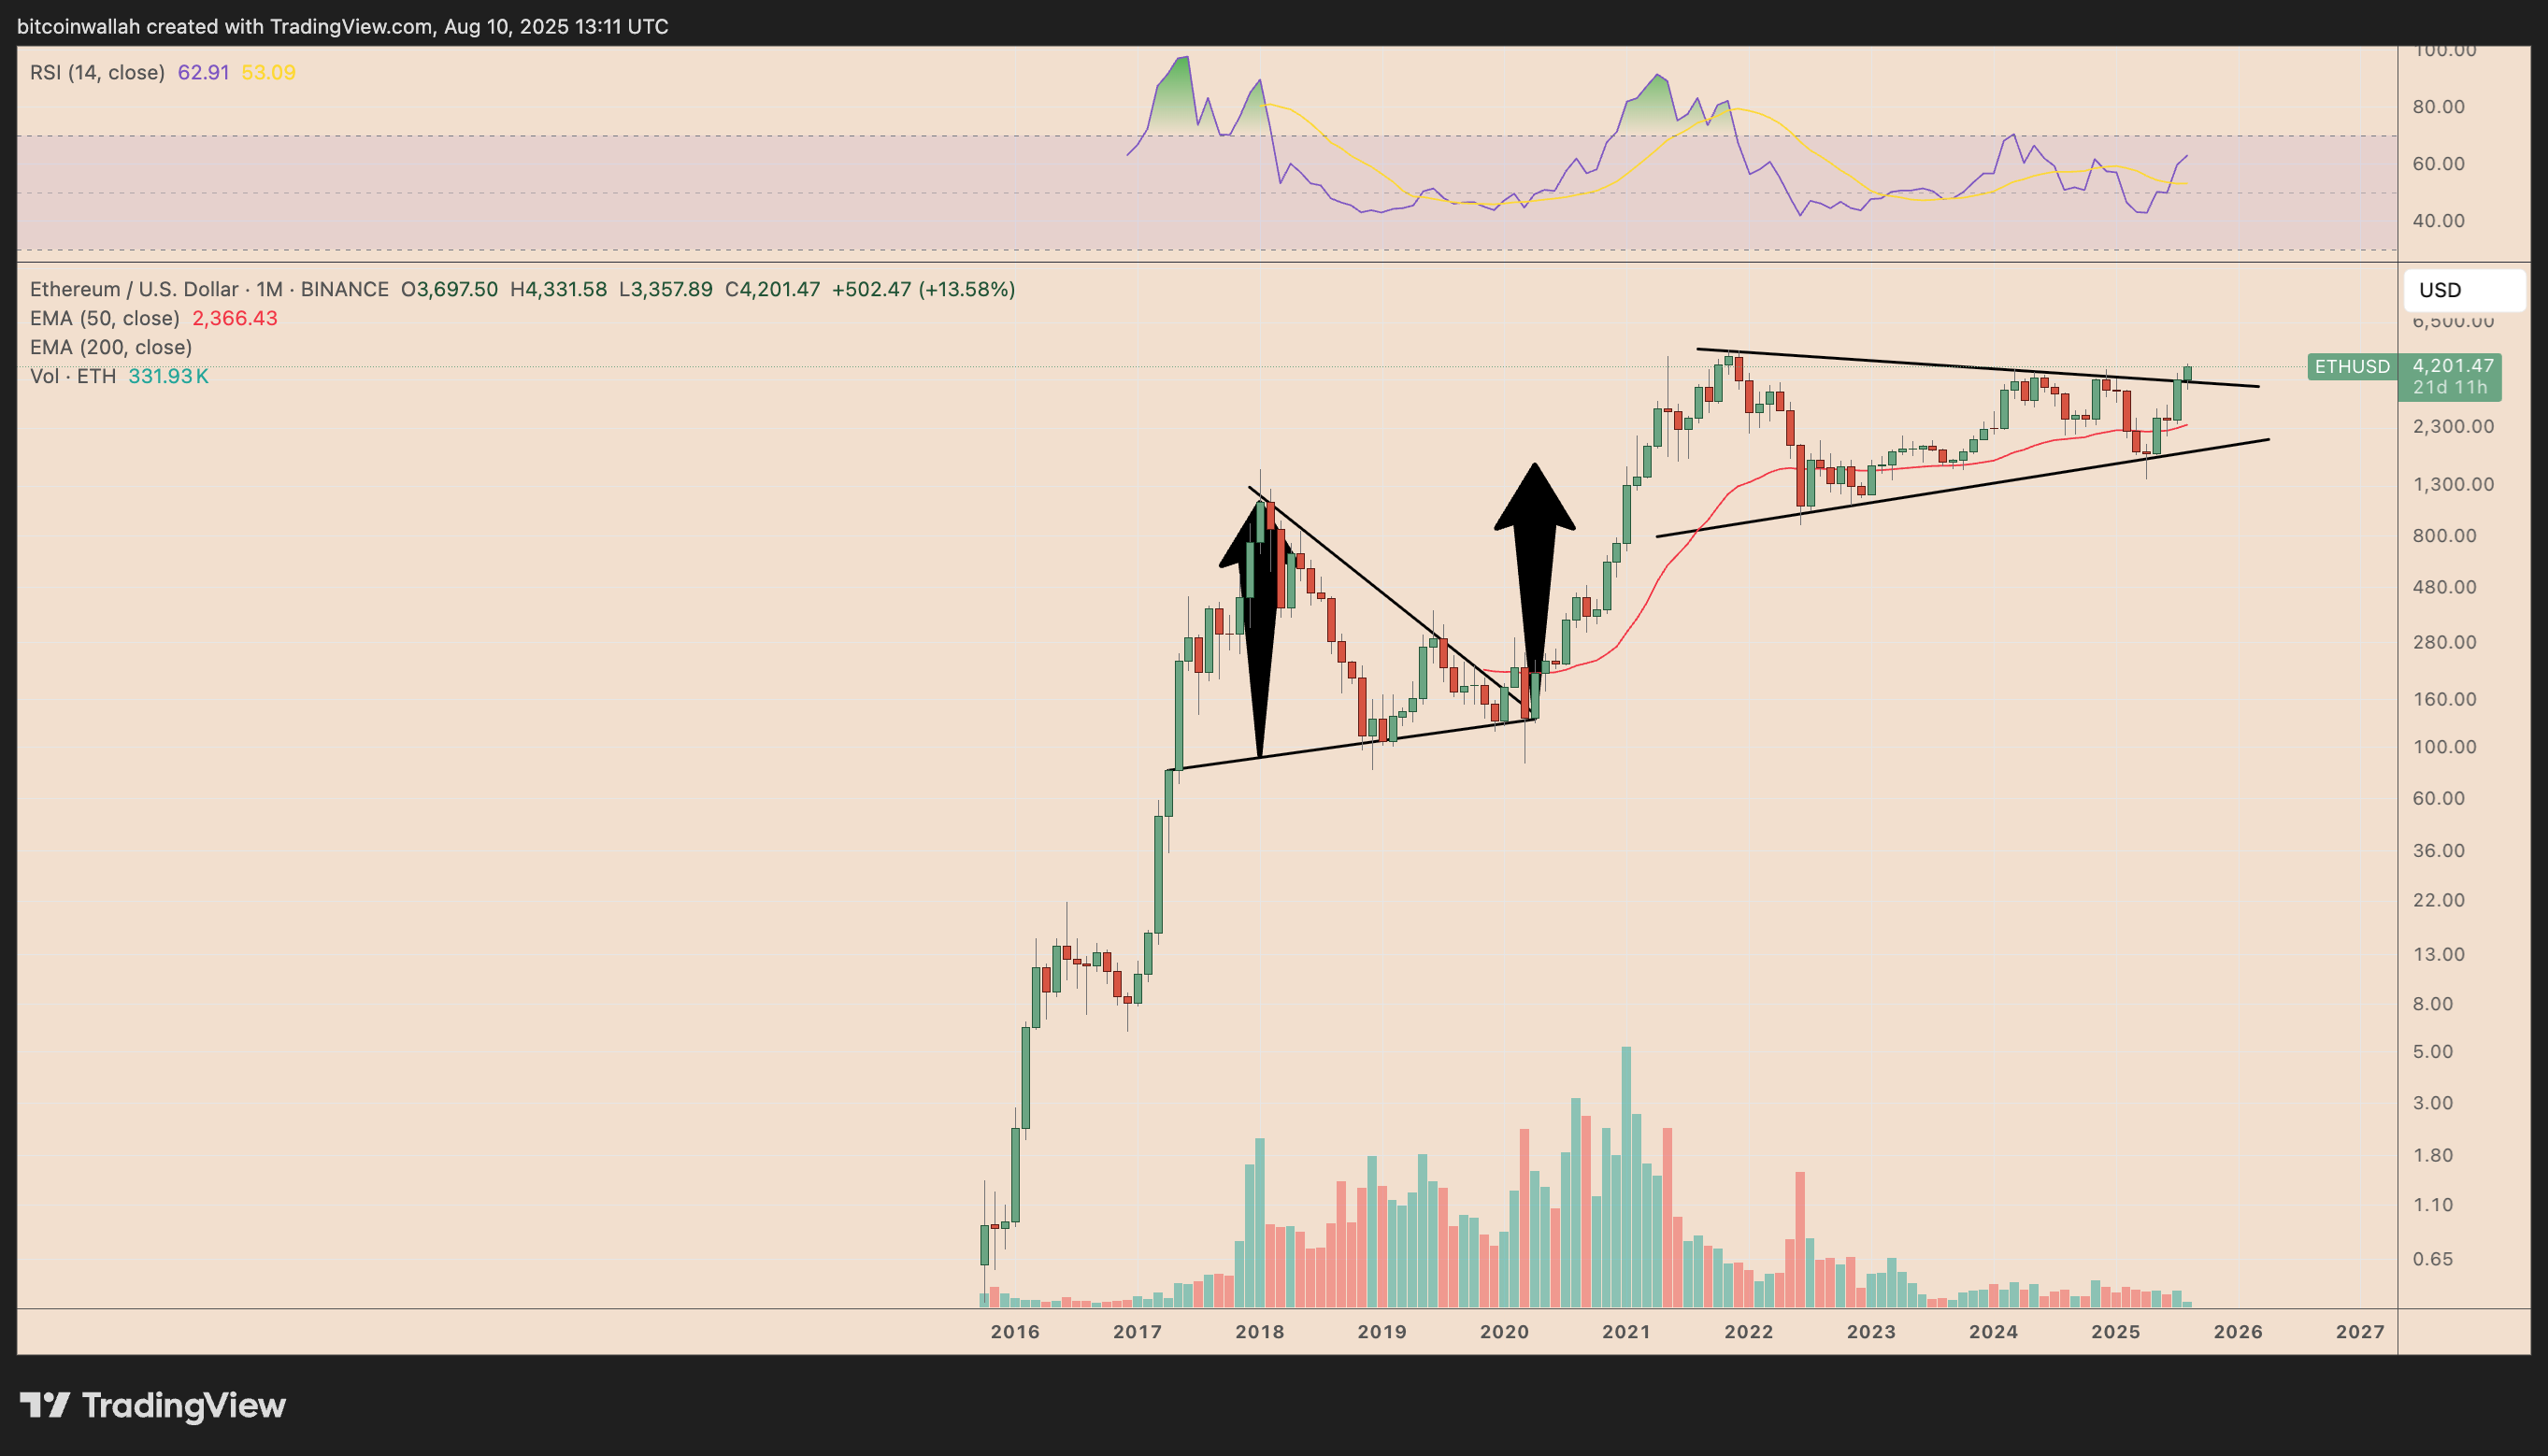
In April 2020, ETH broke out of a symmetrical triangle, surging more than 950% to hit its projected target, and climbing even higher as bullish sentiment intensified.
ETH price fractal makes a case for $20,000
Ethereum may be on track for a run toward $20,000 within 6-8 months from now, if historical price fractals play out.
Analyst Nilesh Verma highlights the repeating pattern, where ETH rallies sharply after retesting a major bottom support.
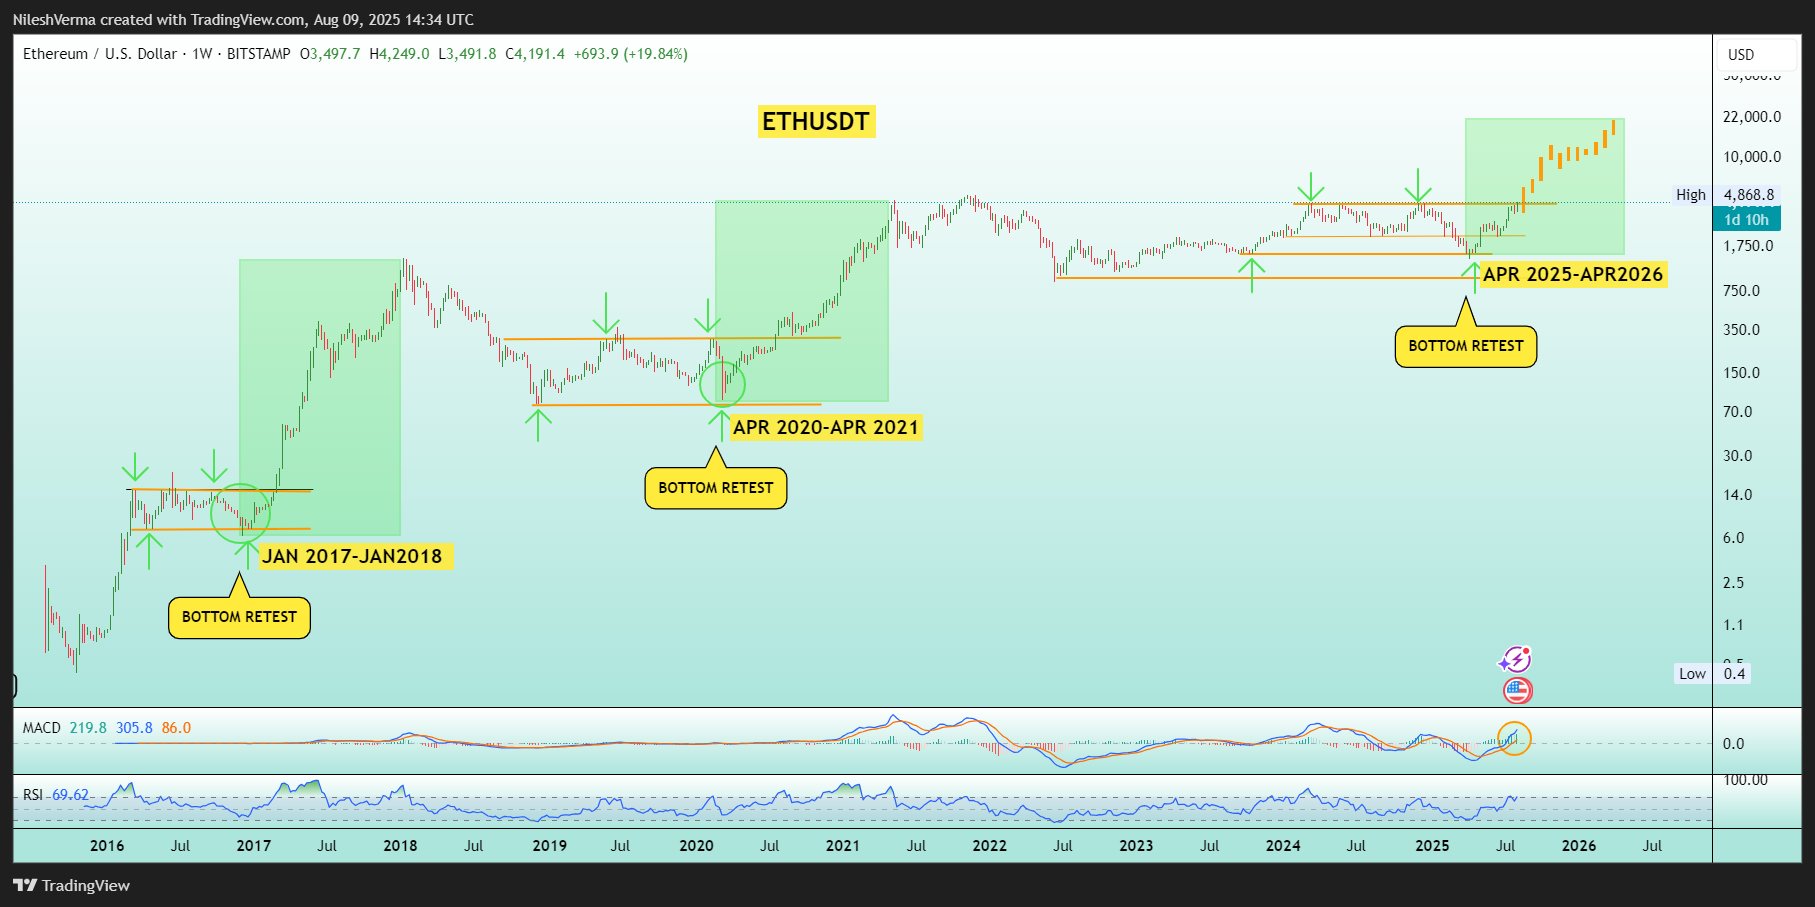
In January 2017 and April 2020, such retests preceded parabolic uptrends, delivering gains of over 8,000% and 950%, respectively. Both moves lasted roughly 12 months before topping out.
ETH repeated the same “bottom retest” setup in April 2025, bouncing strongly from the $1,750–$1,850 zone. A sustained rally could unfold through April 2026, with the fractal’s measured move targeting “$10,000 minimum” and $20,000 in the best-case scenario.
Related: Arthur Hayes buys ETH back at higher prices, pinky swears to never sell
Popular analyst Merlijn The Trader also predicts Ethereum to hit $20,000, citing the cryptocurrency’s multiyear rising channel.
This article does not contain investment advice or recommendations. Every investment and trading move involves risk, and readers should conduct their own research when making a decision.


