
Bitcoin has experienced one of its sharpest corrections in recent years, slipping below the $65,000 level and reaching its lowest price since October 2024. The decline reflects persistent selling pressure across the crypto market, accompanied by deteriorating macro sentiment, reduced liquidity, and cautious positioning among institutional participants. Recent price action suggests the market is entering a critical phase where confidence, rather than technical levels alone, may determine the next directional move.
Related Reading
Amid this uncertainty, the Binance SAFU Fund disclosed the purchase of an additional 3,600 BTC, valued at roughly $233.37 million. While such acquisitions do not guarantee a market reversal, they indicate continued strategic accumulation by major industry players even during periods of elevated volatility.
Market sentiment has deteriorated markedly. Several sentiment indicators now sit near levels last observed during the 2022 bear market, when risk appetite contracted sharply and investors adopted defensive positioning. This environment typically coincides with reduced speculative activity, heightened caution among retail traders, and increased scrutiny from institutional capital.
Arkham data indicates that the Binance SAFU fund has continued accumulating Bitcoin, bringing its total recent purchases to approximately 6,230 BTC, valued near $434.5 million. While such activity signals ongoing participation from large institutional entities, it does not necessarily imply an imminent price recovery. Historically, significant purchases during corrective phases often occur alongside broader market stress rather than marking an immediate turning point.
Current market conditions increasingly resemble a classic capitulation phase. Capitulation typically emerges when sustained price declines force weaker holders to exit positions, often at losses, leading to elevated exchange inflows, compressed liquidity, and sharp sentiment deterioration. These episodes can persist longer than many participants anticipate, particularly when macroeconomic uncertainty, risk-off positioning, and tightening liquidity conditions coincide.
Importantly, capitulation does not follow a fixed timeline. In prior cycles, similar phases unfolded over weeks or even months before a durable bottom formed. During these periods, volatility tends to remain elevated, failed rallies are common, and confidence rebuilds gradually rather than abruptly.
The key variables to monitor include exchange flows, derivatives leverage, spot demand recovery, and broader macro signals. Until those metrics stabilize, the base case remains continued market fragility. Large-scale accumulation by institutional funds may provide structural support, but it rarely prevents extended consolidation or further downside during capitulation environments.
Related Reading
Weekly Structure Shows Breakdown Below Key Support
Bitcoin’s weekly chart shows a clear deterioration in market structure after losing the $70K region, a level that had previously acted as both psychological and technical support. The latest candle reflects strong downside momentum, with price briefly touching the $60K zone before stabilizing near $65.9K. This move confirms a breakdown from the prior consolidation range and shifts focus toward whether this decline represents a deeper bear phase or a late-cycle correction.
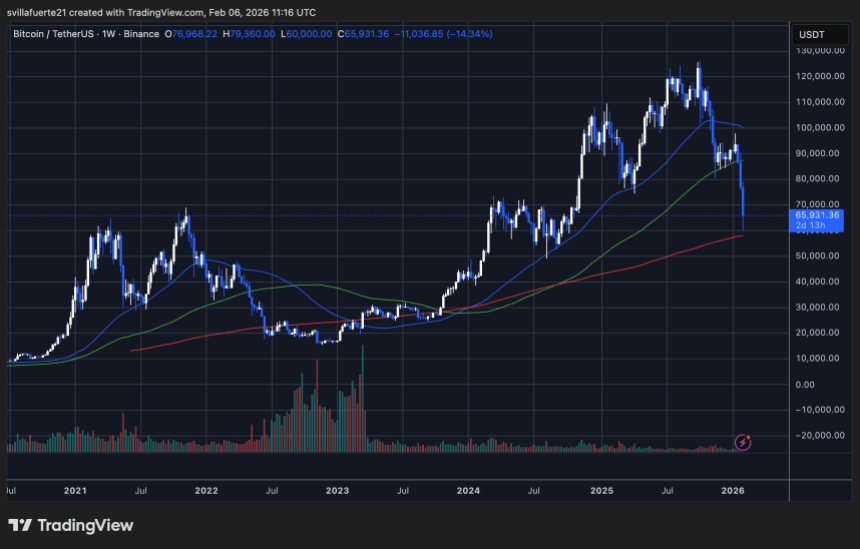
From a trend perspective, Bitcoin is now trading below the 50-week moving average while approaching the 100-week average. Historically, a critical dynamic support during corrective phases. The 200-week average remains far below, indicating the long-term macro trend has not fully reversed, although intermediate momentum has clearly weakened.
Related Reading
Volume dynamics also matter here. The recent selloff shows rising participation compared with earlier consolidation periods, suggesting distribution rather than simple profit-taking. However, sustained high volume without further price acceleration downward could signal seller exhaustion.
If Bitcoin fails to reclaim the $70K area, downside risk toward the $60K–$55K zone remains plausible. Conversely, stabilization above current levels would indicate absorption, a necessary precursor for any meaningful recovery.
Featured image from ChatGPT, chart from TradingView.com


