
Ether’s (ETH) drop below the $2,000 on Friday put it at risk of a deeper correction in the coming weeks or months.
Key takeaways:
-
Ether’s price shows structural weakness as it fails to hold above the $2,000 psychological support.
-
Analysts say ETH price may drop further toward the $1,750-$1,850 support zone.
-
Ether’s demand stays negative, increasing its downward potential.
Ether traders anticipate a deeper correction
Data from TradingView showed ETH/USD trading at $1,975, down 5% over the last 24 hours. This drop was accompanied by more than $111 million in long ETH liquidations.
Related: Bitmine launches institutional Ethereum staking platform
The pair had failed to crack through resistance at $2,200 earlier in the week, as spot Ether exchange-traded fund (ETF) outflows, falling DEX volumes, and declining ETH futures premium derailed Ether’s recovery.
“$ETH keeps pressing into the same resistance, but the story sits beneath price action,” trader Onur said in an X post on Friday, adding:
“Even with strong long-term narratives, short-term demand still looks thin.”
Fellow analyst CryptoWZRD said a ETH could see a “further decline” toward the $1,800 support zone after the altcoin closed below $2,200 on Thursday.
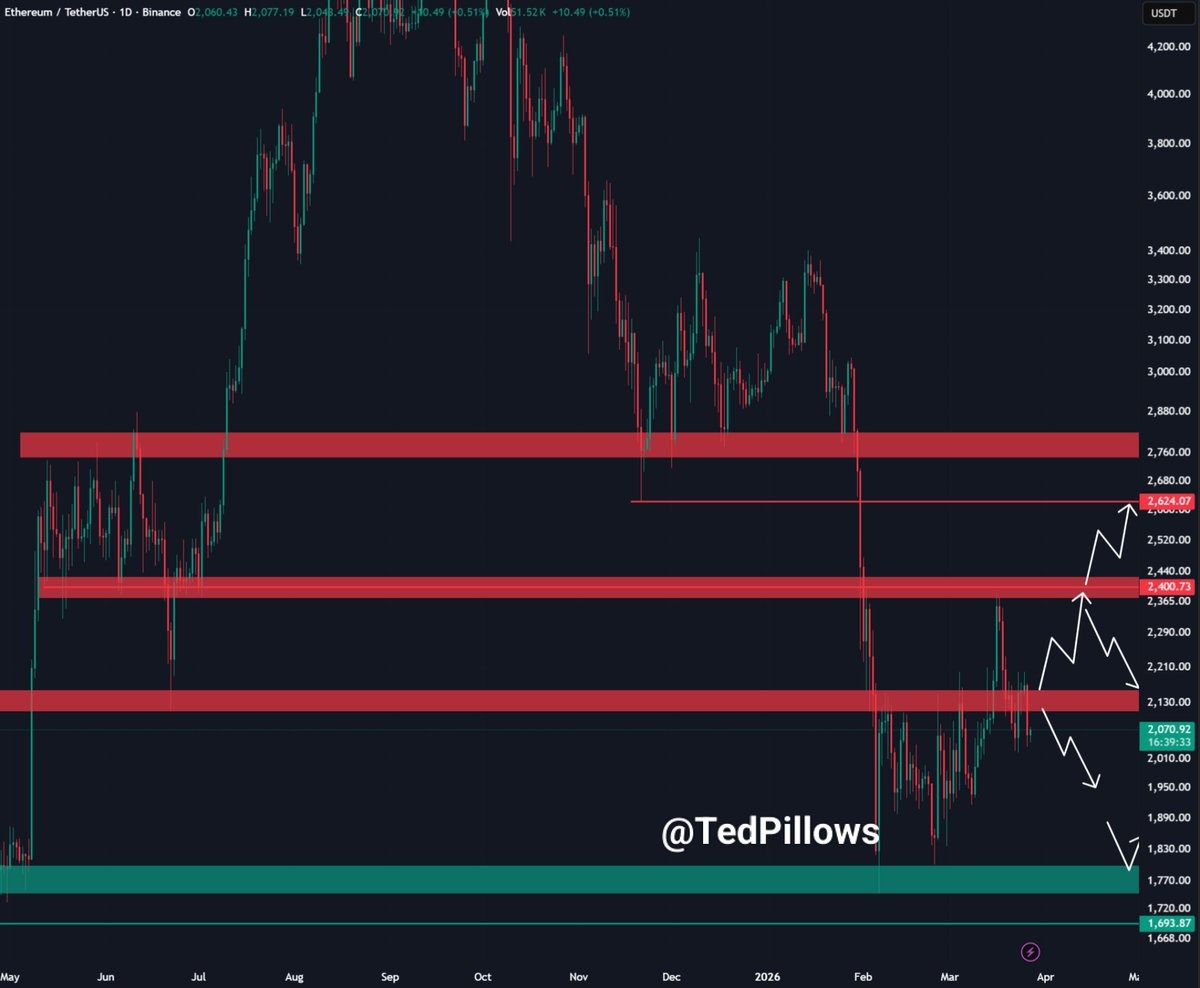
“$ETH has dropped below the $2,100 level,” analyst and trader Ted Pillows said in a Friday X post, adding:
“This is a sign of weakness and shows what’s coming next for ETH.”
An accompanying chart suggested that the price could first drop toward the $1,800 support level, before rebounding.
As Cointelegraph reported, a close below the 50-day simple moving average at $2,000 may pull the ETH/USD pair to $1,900 and subsequently to the $1,850-$1,750 level.
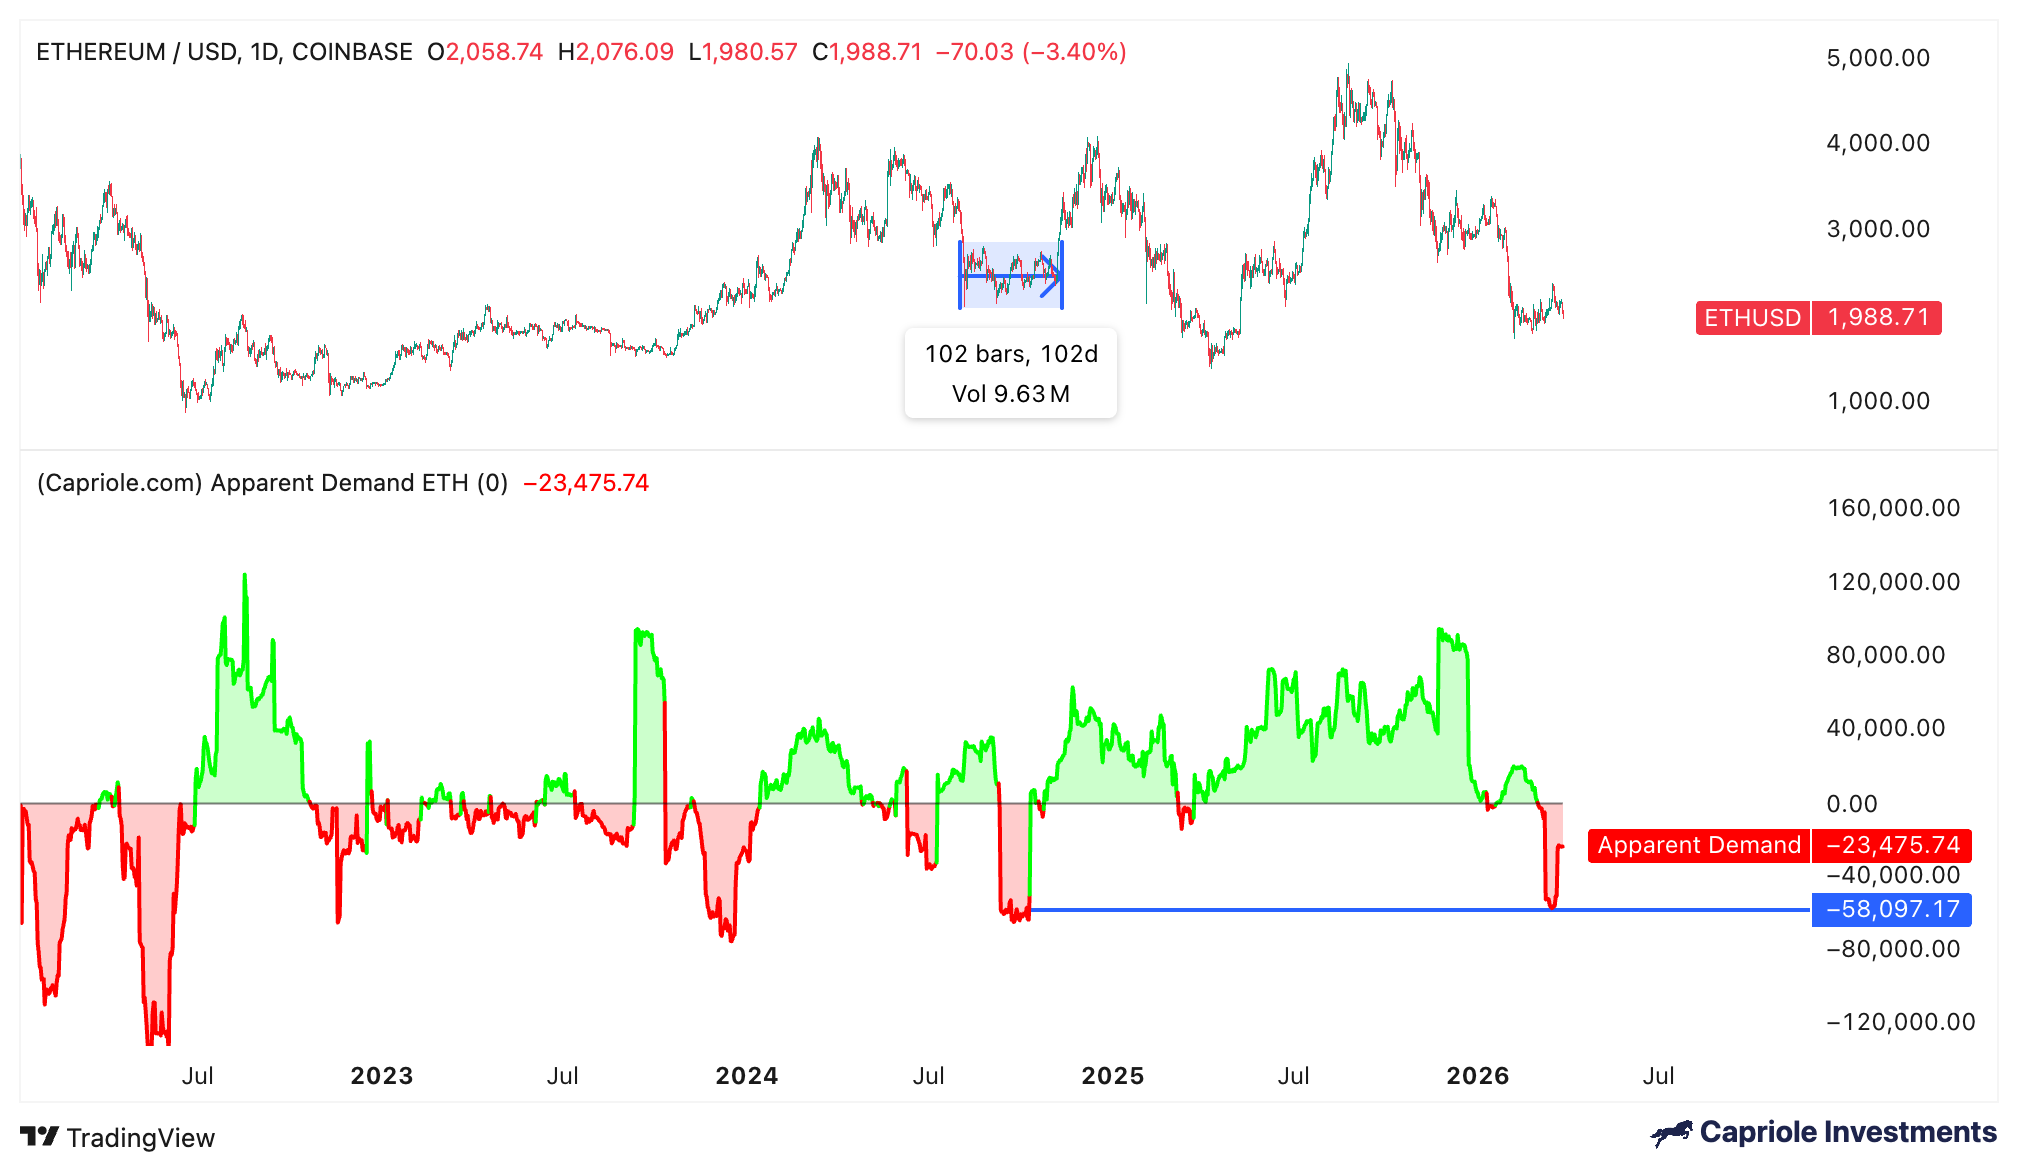
Ether’s apparent demand hits 16-month low
Ether’s Apparent Demand has flipped negative after dropping to its lowest level since October 2024, as traders adopted a risk-off stance due to geopolitical uncertainty and macro headwinds.
Capriole Investment’s Ethereum Apparent Demand metric shows that the demand for ETH has been negative since March 3, bottoming around -58,000 ETH on March 16, marking 16-month lows. The metric has since improved to -23,475 ETH at the time of writing.
Meanwhile, spot ETH ETFs have recorded net outflows for seven consecutive days, totaling $391.8 million.
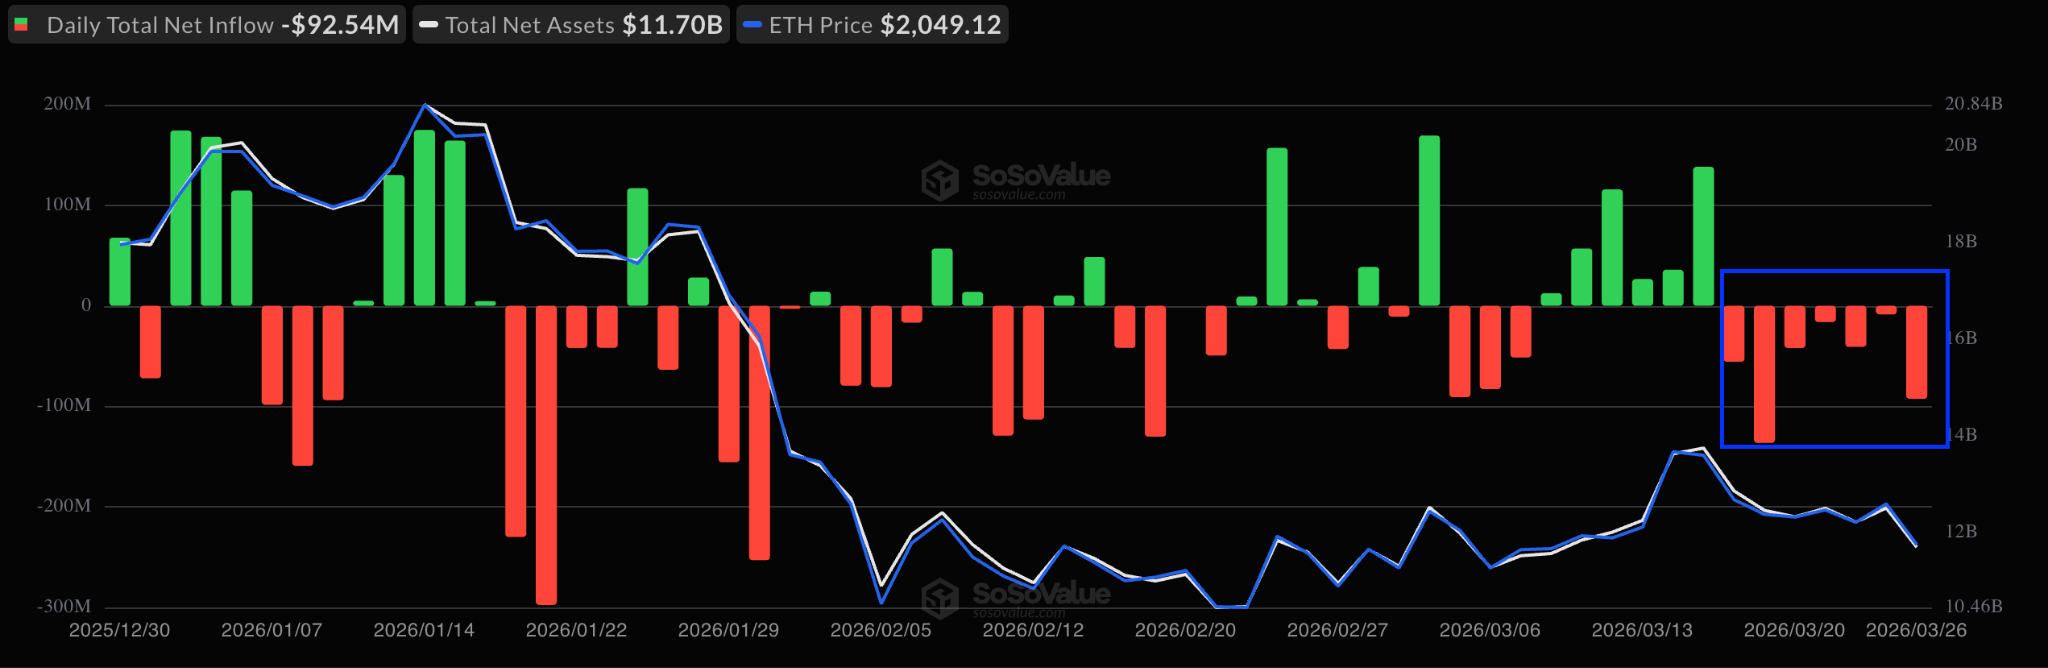
Global Ether exchange-traded products (ETPs) also recorded $27.2 million of outflows last week, reinforcing reduced appetite for ETH among institutional investors.
This article does not contain investment advice or recommendations. Every investment and trading move involves risk, and readers should conduct their own research when making a decision. While we strive to provide accurate and timely information, Cointelegraph does not guarantee the accuracy, completeness, or reliability of any information in this article. This article may contain forward-looking statements that are subject to risks and uncertainties. Cointelegraph will not be liable for any loss or damage arising from your reliance on this information.


