
Dogecoin’s largest holders are becoming more active just as a widely followed analyst says DOGE printed its third clear monthly bullish morning star pattern. The overlap matters because the signal is not only technical: Santiment’s on-chain data shows whale activity and whale balances rising at the same time as DOGE rebounds from recent lows.
Santiment Intelligence said Dogecoin whales recorded their busiest day in six months, with 739 transfers worth at least $100,000 in a single 24-hour span. The firm also noted that the largest DOGE wallets have continued to accumulate.
Related Reading
“On-chain data indicates that Dogecoin’s whales have just hit a 6-month high in activity, with 739 $100K+ transfers in just a 1-day span. Additionally, of the 149 whale wallets holding at least 100M Dogecoin, they now collectively hold an all-time high of 108.52B DOGE (worth $11.6B). The memecoin’s +14% price rise over the past 10 days is very likely not just a coincidence.”
Dogecoin Monthly Chart Signals Possible Reversal
That on-chain backdrop coincides with Cantonese Cat’s monthly Dogecoin chart, which marks what the analyst described as “the third clear monthly bullish morning star pattern for DOGE.”
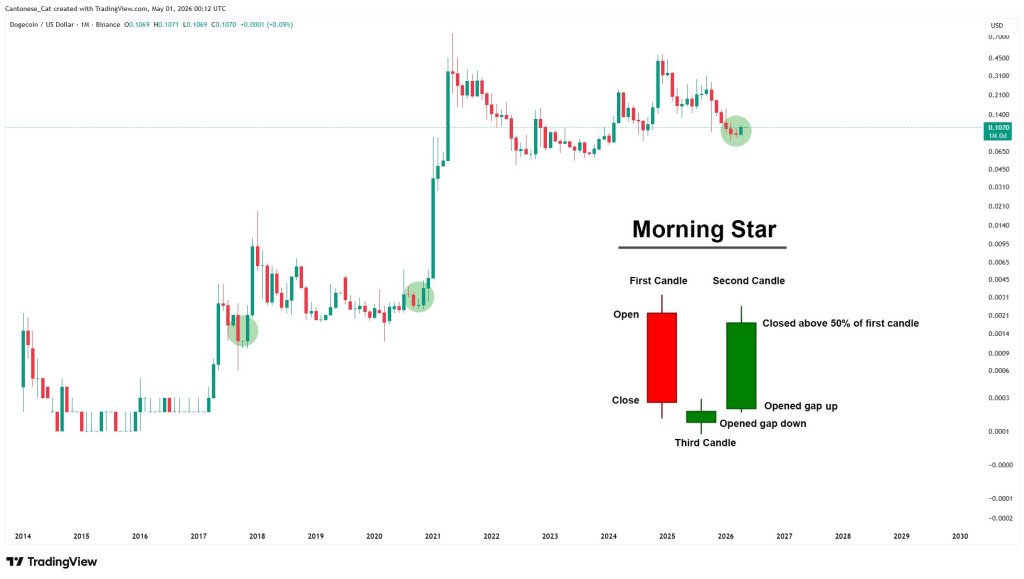
A morning star is a three-candle reversal formation. In the DOGE chart, the first candle is a red down candle (February), the second is a smaller candle (March) that reflects hesitation after the selloff, and the third is a green candle (April) that closes back above the midpoint of the first candle.
In crypto markets, where trading is continuous and traditional equity-style gaps are less clean, analysts often focus more on the structure: a sharp monthly decline, a compression or indecision candle, and then a strong recovery candle that shifts control back toward buyers.
Related Reading
Cantonese Cat’s DOGE chart highlights two previous comparable monthly formations. The first appeared from September to November 2017, after Dogecoin consolidated after a major 2,000% rally and just before the token’s major run into the 2017–2018 cycle peak. The second appeared from September to November 2020, shortly before DOGE broke into its historic 2021 rally.
The analyst also used Bitcoin as a reference point for why he views the pattern as relevant. In a separate BTC monthly chart, Cantonese Cat wrote that a bullish monthly morning star had “marked 3 out of 4 past cycle bottoms,” “2 very important local bottoms,” and produced “2 false signals,” giving it a stated success rate of 71.4% for Bitcoin.
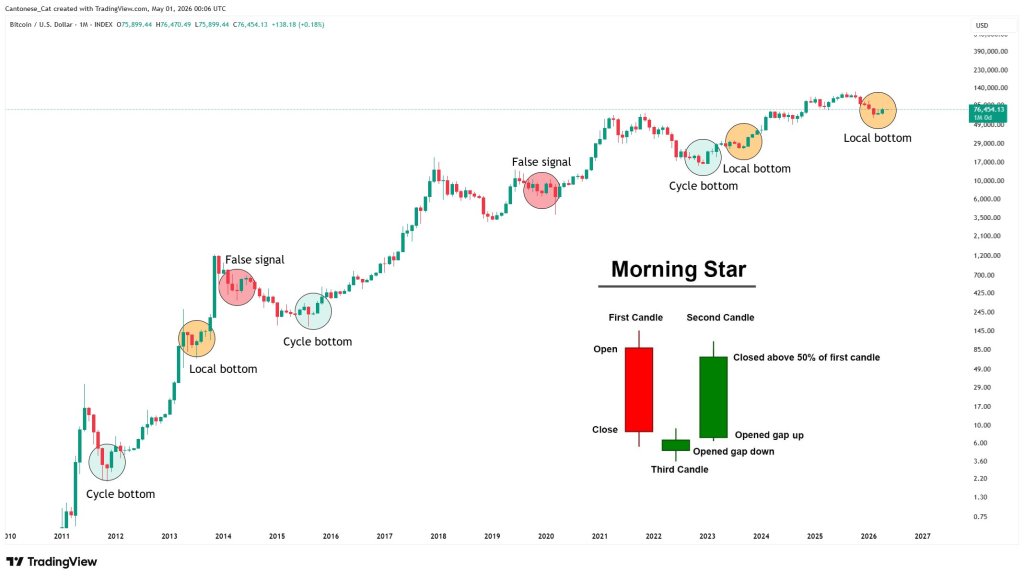
That comparison does not guarantee the same outcome for DOGE, but it frames the pattern as one he treats as historically meaningful across major crypto charts, and again, Bitcoin could be a leading indicator.
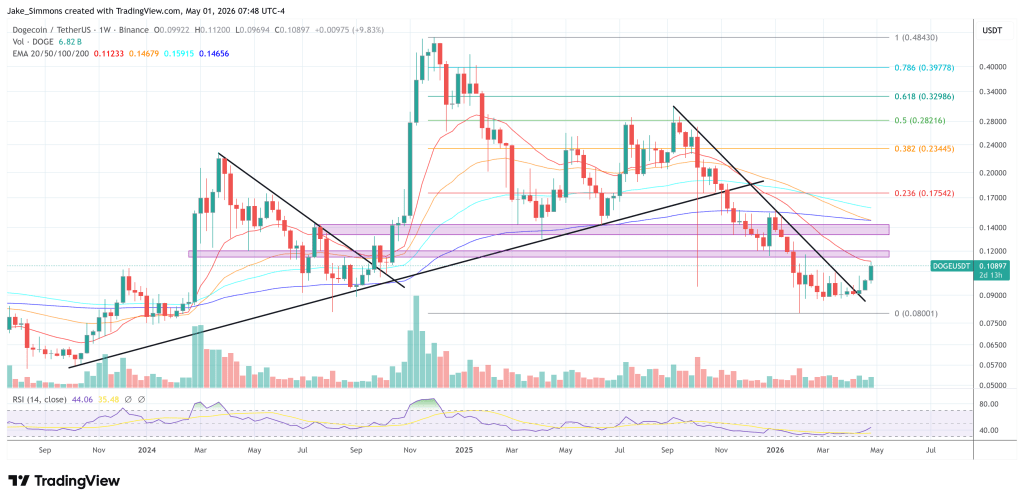
At press time, DOGE traded at $0.10897.
Featured image created with DALL.E, chart from TradingView.com


