
Reason to trust
Strict editorial policy that focuses on accuracy, relevance, and impartiality
Created by industry experts and meticulously reviewed
The highest standards in reporting and publishing
Strict editorial policy that focuses on accuracy, relevance, and impartiality
Morbi pretium leo et nisl aliquam mollis. Quisque arcu lorem, ultricies quis pellentesque nec, ullamcorper eu odio.
Solana could be on track for a massive 323% rally this altcoin season, according to a new technical analysis by crypto strategist Quantum Ascend, who projects a potential peak around $830 based on market cap extensions and Elliott Wave structures. In a detailed July 22 breakdown, the analyst argues that most retail traders continue to overlook the impact of inflation and token supply dynamics—factors that significantly affect price projections.
Solana To $1,000 Is Not Realistic Thus Cycle
“Looking at the market cap chart, it’s up almost 216,000%, while the price chart is only up 18,000%. So what this tells us is, there’s some kind of inflationary pressure on the asset,” Quantum Ascend said. “You have to use the market cap chart in order to measure the price.”
Using Elliott Wave Theory, the analyst identified Solana as currently operating within a macro third wave—arguably the strongest phase of a five-wave impulse sequence. According to his count, Solana completed its first and second macro waves during previous market cycles and is now accelerating through the early stages of wave three, a move that could culminate in a parabolic rally.
Related Reading
“Right now, what we’re working on is this macro wave three,” he explained. “The bear market will be macro four, and then we’ll have another wave at some point well into the future.”
To support this thesis, Quantum Ascend pulled Fibonacci extensions from Solana’s historical price structures. He pointed to confluence between the 2.618 extension of the most recent accumulation range and the 3.618 extension of a broader range, both of which intersect near a $300 billion market cap. However, he views this zone as a mid-cycle checkpoint rather than a terminal target.
His conservative scenario puts Solana at a $620 price tag, representing a 217% move from current levels. But his primary projection suggests a 323% rally, translating to an $830 top based on market cap behavior and structural alignment. He cautioned that simply targeting round numbers like $1,000 can mislead traders, especially when inflation-adjusted market cap analysis tells a different story.
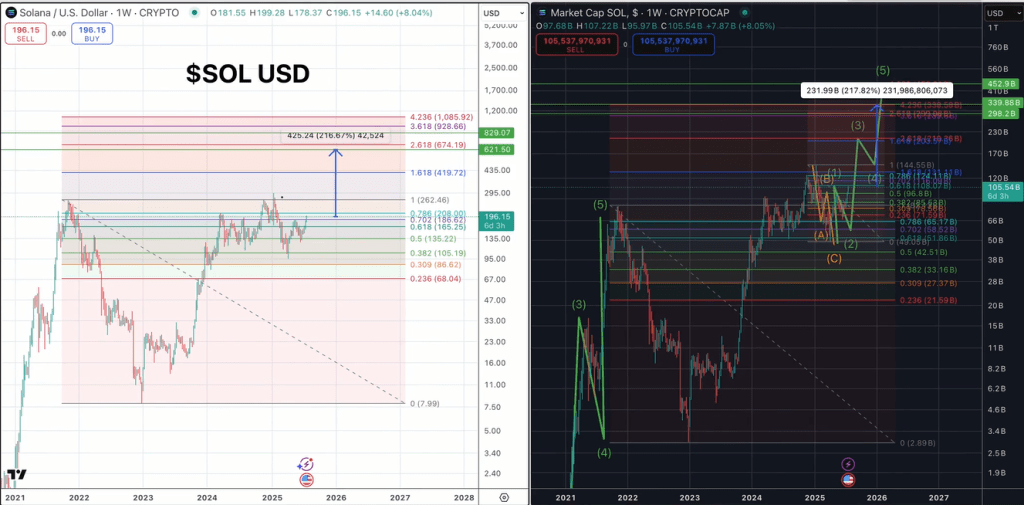
“If I pull those same extensions here for Solana [on the price chart], because of the inflation, you’d be looking for $1,000, which is a nice round number and something that retail would love to hear,” he said. “But the market cap chart shows it’s topping that same extensions only at $830.”
Related Reading
The discrepancy arises from Solana’s token inflation. As new tokens enter circulation, they dilute the impact of price movements. This is why, Quantum Ascend insists, market cap projections provide a more accurate view of potential upside. “There’s not enough people paying attention to market cap. You have to do it,” he emphasized.
In his final breakdown, the analyst laid out both price zones. “We have $620 as our conservative, $830 as our primary here for Solana,” he concluded. While some viewers may find the upper bound modest compared to speculative retail targets, he stressed the importance of realism over hype. “We’re trying to make sure that we’re not buying into any crazy narratives or anything and we’re not leaving anything on the table and we’re not round tripping our bags.”
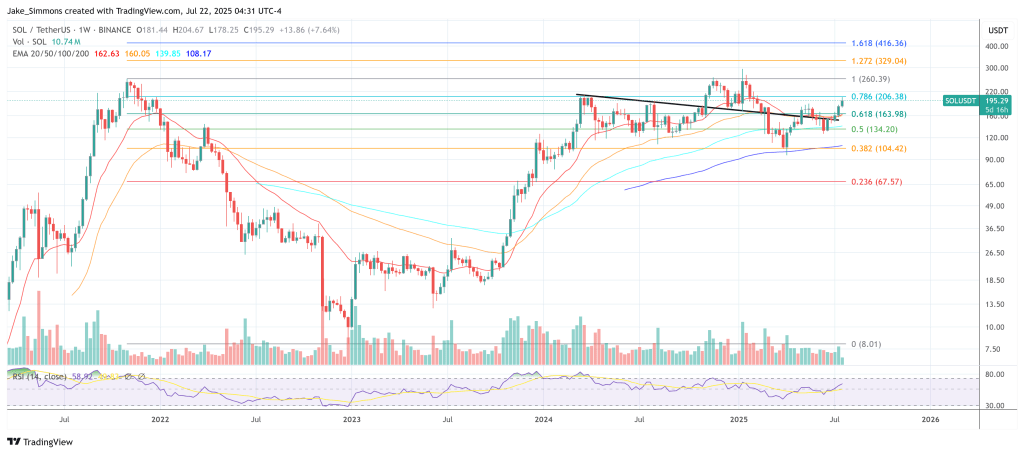
At press time, SOL traded at $195.
Featured image created with DALL.E, chart from TradingView.com