Data shows extreme fear sentiment in the Bitcoin market has continued for almost a month now, the longest stretch since April 2020.
Bitcoin Market Sentiment Remains In Extreme Fear Territory
As per the latest weekly report from Arcane Research, the crypto fear and greed index has continued to point at extreme fear this week.
The “fear and greed index” is an indicator that measures the general market sentiment among Bitcoin and crypto investors.
The metric uses a numeric scale that runs from one to hundred for representing this sentiment. All values above “50” signify greed in the market, while those below the threshold suggest fear among investors.
The extreme values of above 75 and below 25 imply sentiments of “extreme fear” and “extreme greed,” respectively.
Historically, bottoms in the price of Bitcoin have tended to form during periods of extreme fear. On the other hand, the crypto has observed tops during stretches of extreme greed.
Some investors think that because of this, it’s best to buy during extreme fear, while extreme greed is ideal for selling.
Related Reading | Bitcoin LTHs Realized Significant Losses Recently, Final Capitulation Here?
“Contrarian investing” follows this approach. Warren Buffet’s famous quote sums it up: “Be fearful when others are greedy, and greedy when others are fearful.”
Now, here is a chart that shows the trend in the Bitcoin fear and greed index over the past year:
The value of the indicator seems to have been quite low recently | Source: Arcane Research's The Weekly Update - Week 21, 2022
As you can see in the above graph, the Bitcoin fear and greed index has a value of 16 right now, suggesting that the market is extremely fearful.
These low values of the metric have remained for almost a month now, making it the longest stretch of extreme fear since right after the COVID crash back in April 2020.
Related Reading | Bitcoin Exchange Outflows Suggest That Investors Are Starting To Accumulate
The report notes that long periods of poor sentiment aren’t extraordinary in the crypto market, but in the past such stretches have usually observed temporary spikes to better sentiment.
In the month of May, there was no such interruption that provided Bitcoin investors with a glimmer of hope.
BTC Price
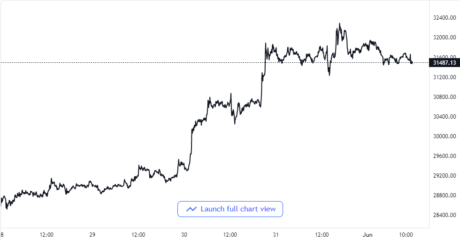
At the time of writing, Bitcoin’s price floats around $31.4k, up 6% in the last seven days. Over the past month, the crypto has lost 16% in value.
The below chart shows the trend in the price of the coin over the last five days.
Looks like the price of the crypto has observed a push up in the last couple of days | Source: BTCUSD on TradingView
Bitcoin has now maintained strongly above the $31k mark for the first time since the beginning of May. However, at the moment, it’s unclear whether this recovery will last.
Featured image from Unsplash.com, charts from TradingView.com, Arcane Research


