On-chain data shows the Bitcoin puell multiple has started to leave the “buy” zone, a sign that the crypto may be heading towards bullish momentum.
Bitcoin Puell Multiple Has Gone Up In Value During Recent Days
As pointed out by an analyst in a CryptoQuant post, the BTC puell multiple is currently breaking out of the historic buy zone.
The “puell multiple” is an indicator that measures the ratio between the daily miner revenues (in USD) and the 365-day moving average of the same.
What this metric’s value tells is how much Bitcoin miners are currently making compared to the average for the past year.
When the value of the indicator rises, it means miner revenues are going up right now. This leads to miners becoming more likely to sell and the price may be called “overvalued.”
Related Reading | On-Chain Data: Bitcoin Whales With 10k+ BTC Have Been Growing
On the other hand, decreasing values of the metric can suggest the price is becoming more undervalued as miner revenues are moving down.
Now, here is a chart that shows the trend in the Bitcoin puell multiple over the last several years:
The value of the metric seems to have observed some rise recently | Source: CryptoQuant
As you can see in the above graph, the Bitcoin puell multiple was in the “buy” zone until just a little while ago.
Historically, this zone with indicator values less than 0.5 has been a sign that the price of the crypto is currently undervalued. Bear bottom formations have taken place here.
Related Reading | Bitcoin Funding Rate Remains Positive, More Decline Soon?
There is also an opposite area, the “sell” zone, which represents values of the multiple greater than 4. Naturally, BTC is overvalued in this region.
Very recently, the puell multiple has seen some uplift and has now just broken out of the green zone. During the past, this has usually been a sign that the crypto is now heading towards bullish momentum.
One thing should be noted, however, that in the past a breakout from the region doesn’t mean a rally would necessarily begin immediately. There could still be a few more months of buildup before a proper run can begin.
BTC Price
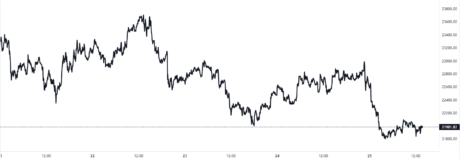
At the time of writing, Bitcoin’s price floats around $21.9k, down 1% in the last seven days. Over the past month, the crypto has gained 3% in value.
The below chart shows the trend in the price of the coin over the last five days.
Looks like the value of the crypto has sunk down during the last few days | Source: BTCUSD on TradingView
After holding above $22k for about a week, Bitcoin seems to have dipped below the level over the past 24 hours.
Featured image from Kanchanara on Unsplash.com, charts from TradingView.com, CryptoQuant.com


