
Bitcoin (BTC) stayed lower at the Feb. 24 Wall Street open as United States macroeconomic data showed inflation biting back.
PCE sparks fresh doubts on inflation
Data from Cointelegraph Markets Pro and TradingView followed BTC/USD as it traded in a narrowing range around $23,800.
The pair saw an attempt to reclaim $24,500 the day prior, but this ultimately proved unsuccessful as resistance kept gains in check.
Bitcoin nonetheless saw only a muted reaction to the latest U.S. Personal Consumption Expenditures (PCE) Index print, which at 4.7% versus 4.3% forecast suggested that inflation was not ebbing as quickly as hoped.
For popular commentator Tedtalksmacro, this was cause for the Federal Reserve to consider a larger interest rate hike at its March meeting — a potential headwind for risk assets including crypto.
“Here comes the speculation of 50bps in March,” he argued in part of a Twitter reaction.
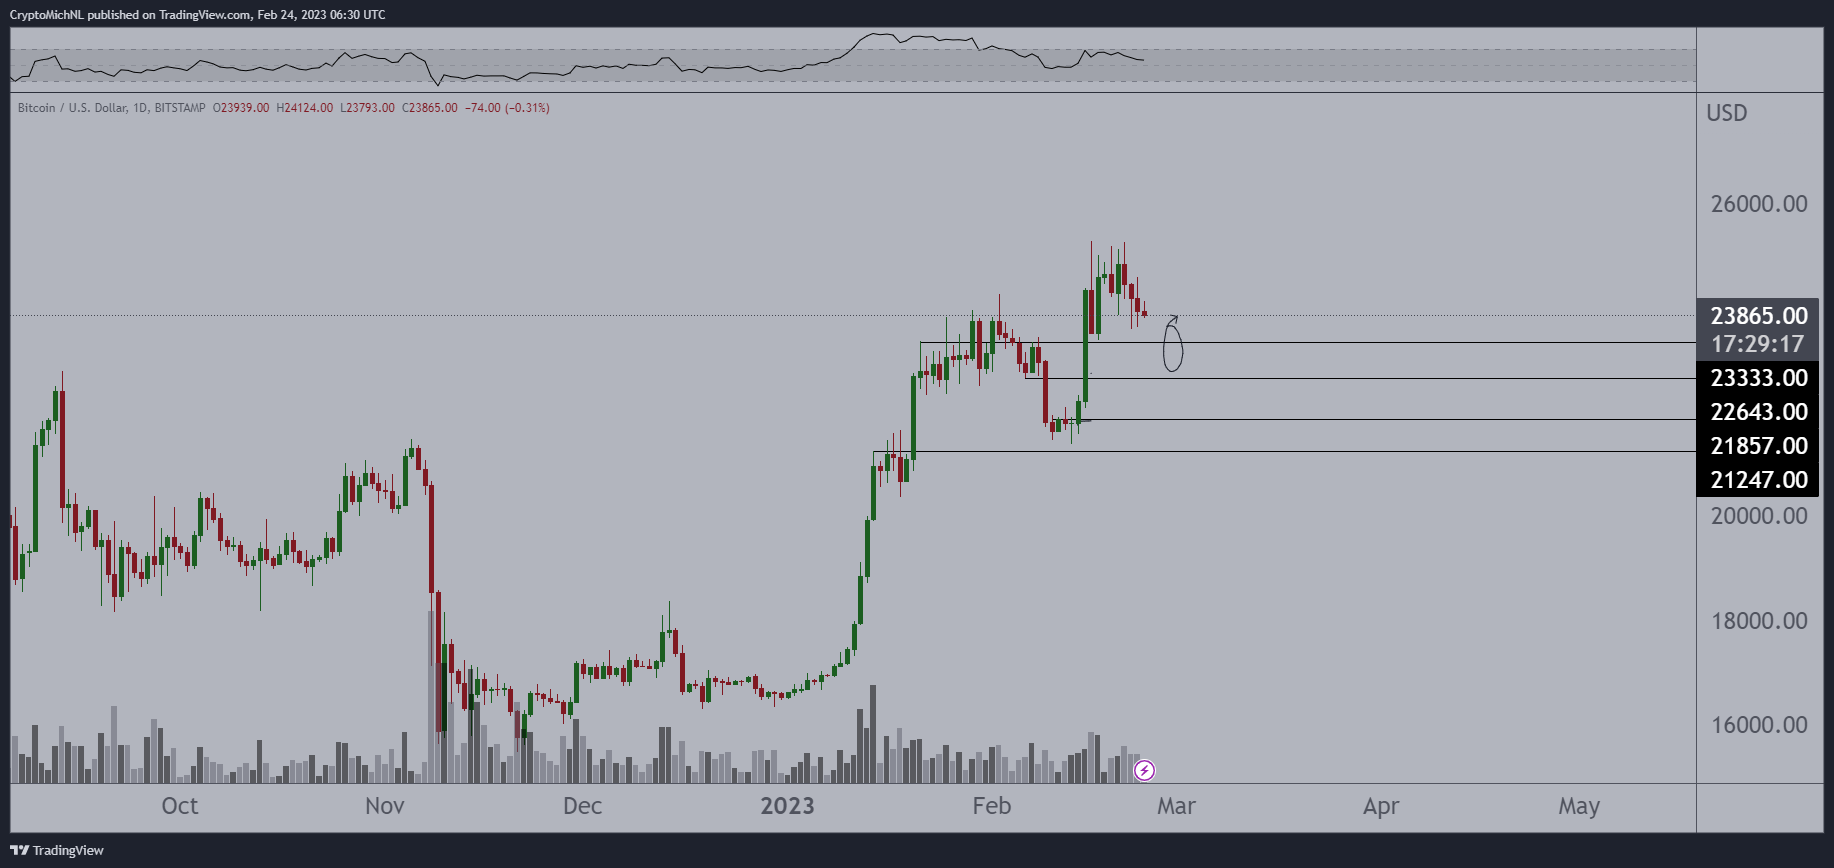
Focusing on BTC/USD itself, Cointelegraph contributor Michaël van de Poppe meanwhile remained upbeat on the short-term prospects.
“The markets are still having a regular correction inside an uptrend,” he wrote alongside a chart with significant levels highlighted.
“As long as Bitcoin remains above $22K, this would be sufficient to expect continuation towards $25K+.”
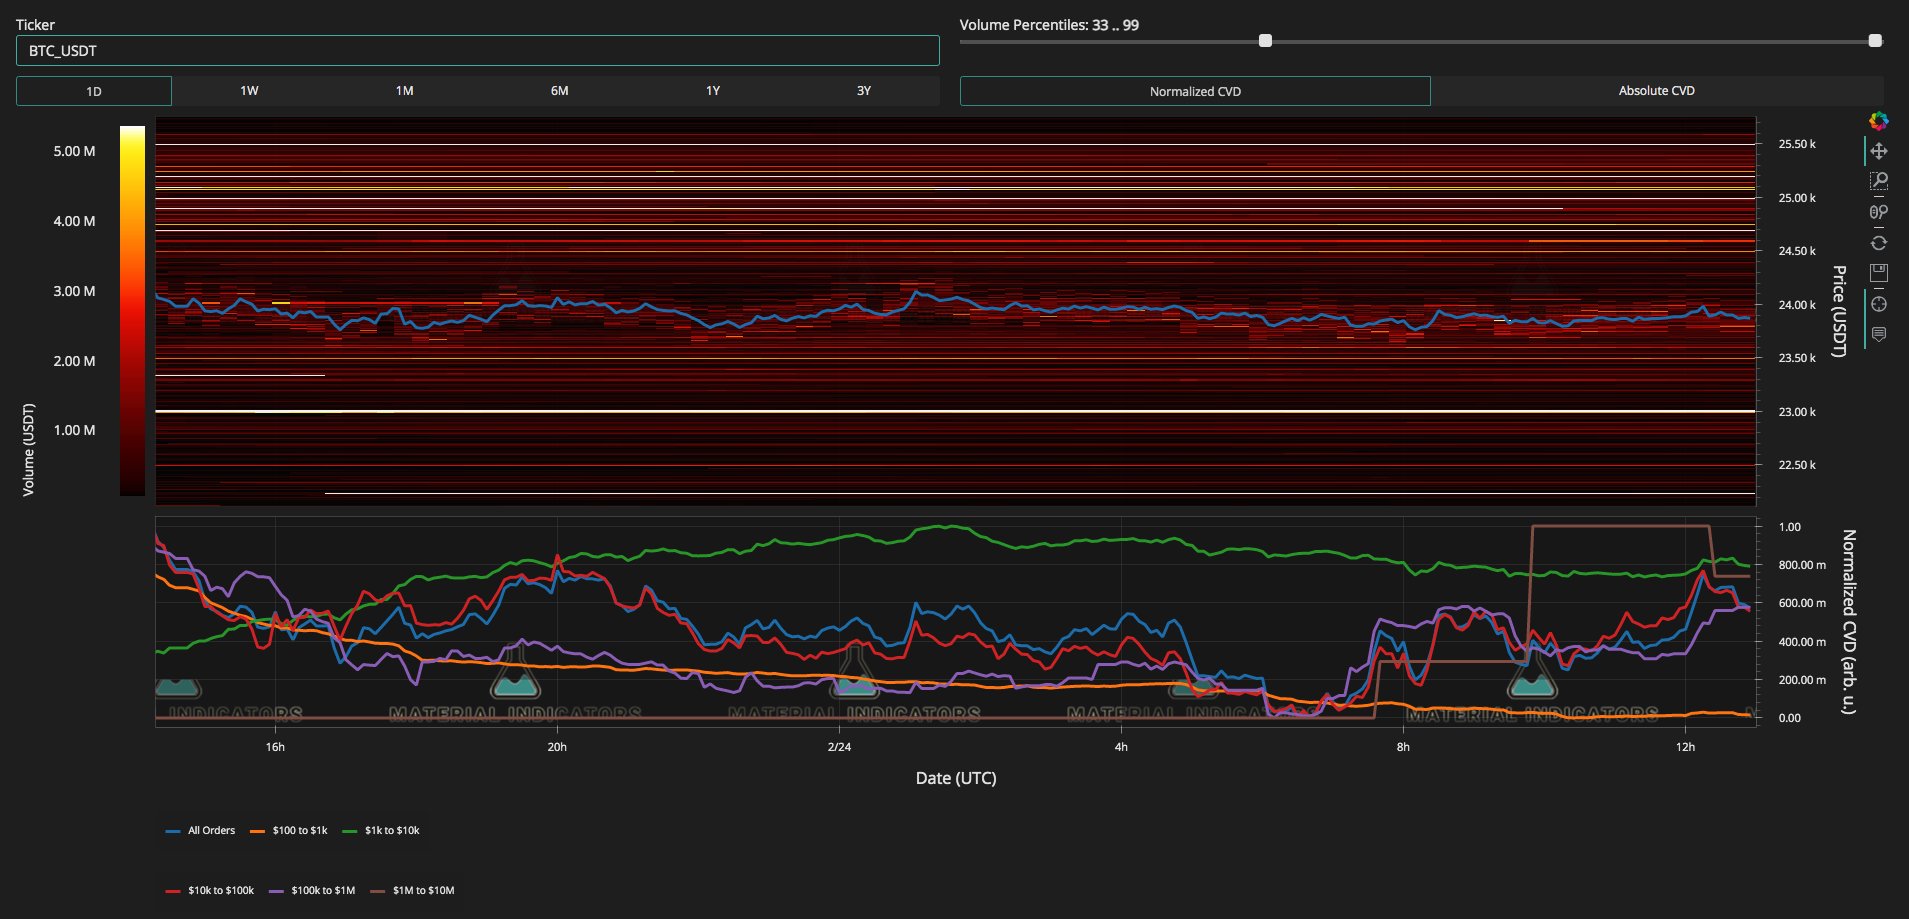
Monitoring resource Material Indicators showed resistance on the Binance order book laddered above spot price, with most support at $23,000.
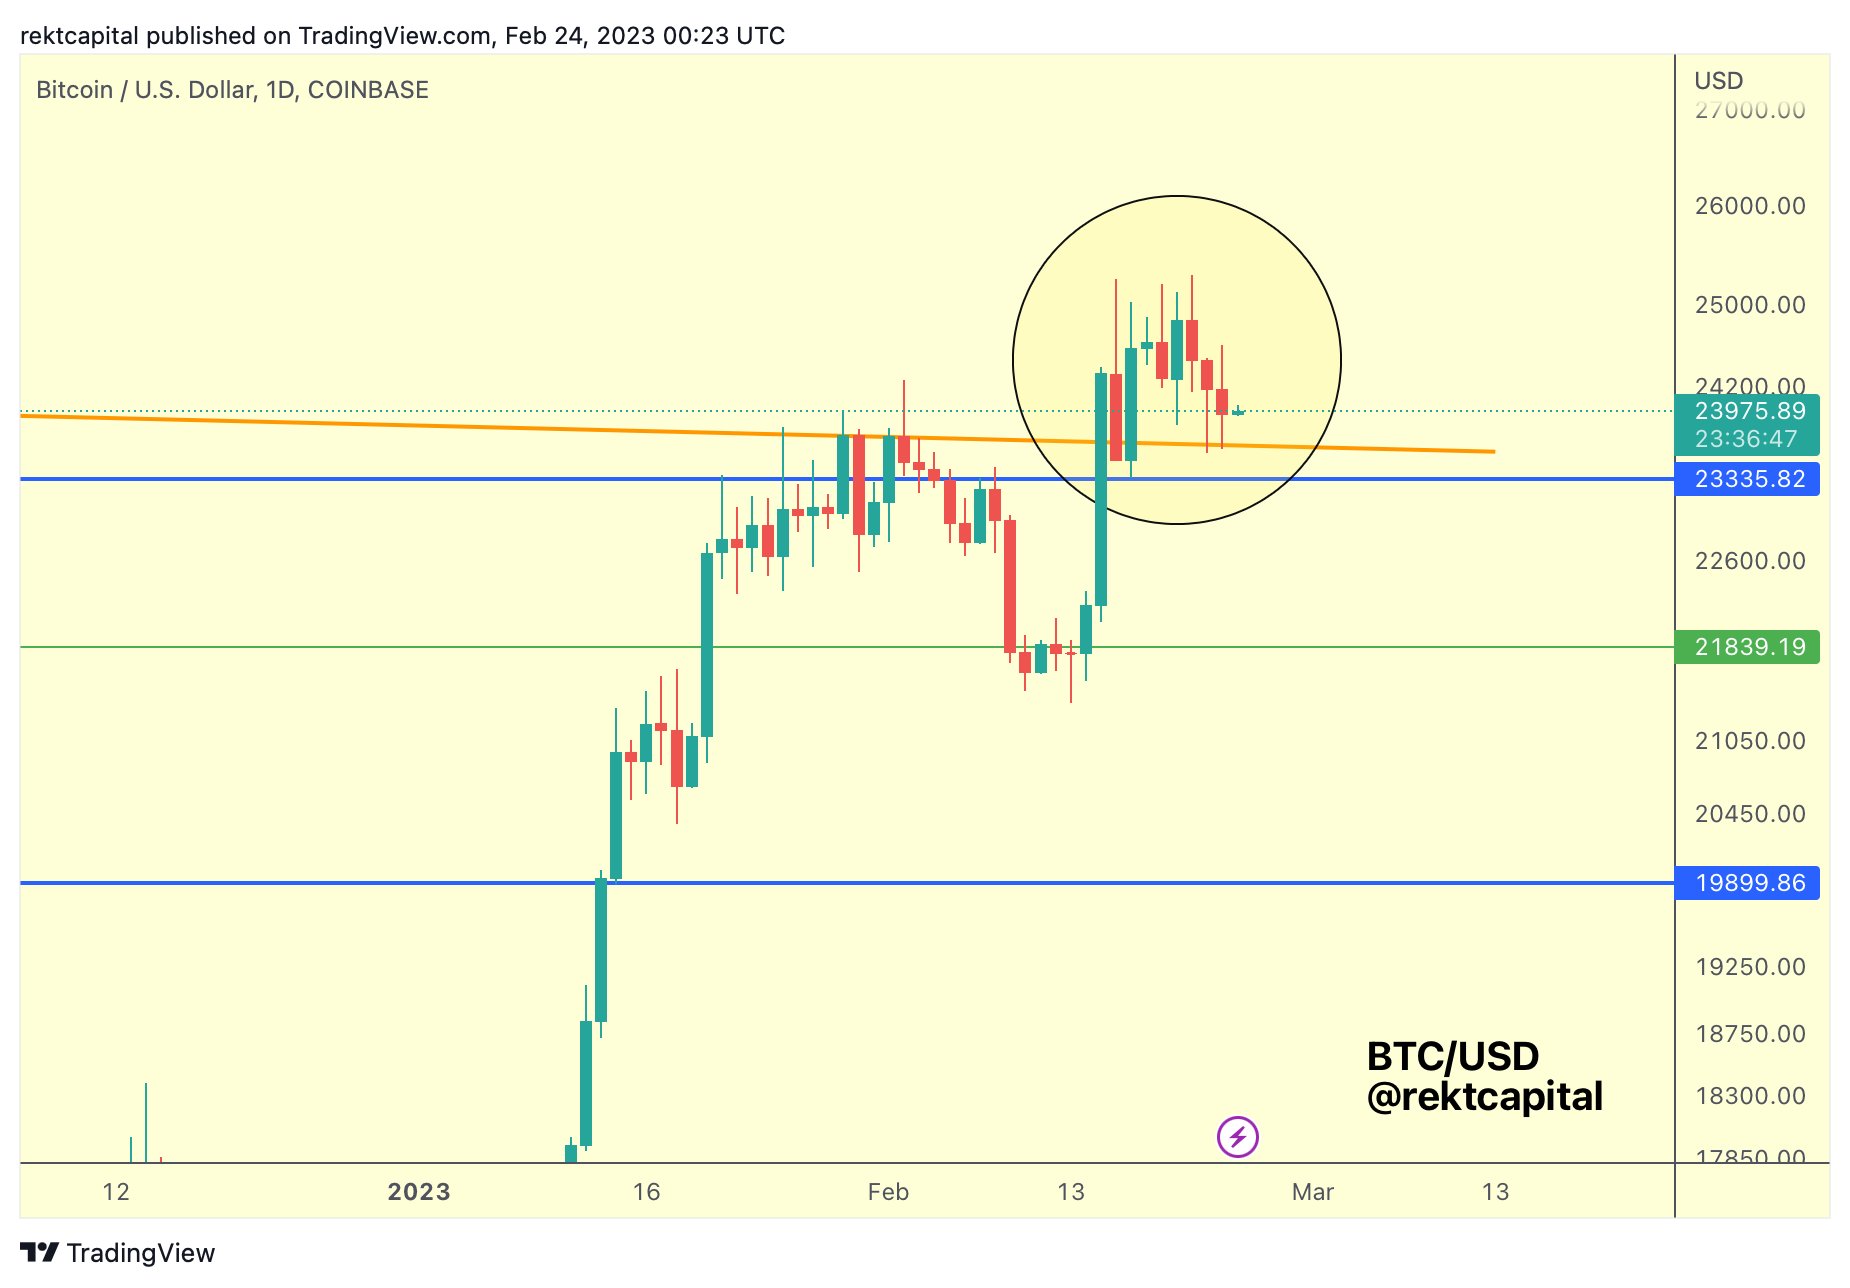
Popular trader and analyst Rekt Capital additionally showed that BTC/USD was attempting to hold a trend line recently flipped to support on intraday timeframes.
“There hasn’t been a 3rd consecutive retest yet but BTC is still holding above the Lower High resistance,” he tweeted.
“If this price stability continues here, one could make the argument that price is slowing in the sell-side momentum against this new Lower High support.”
U.S. dollar challenges 2023 high
U.S. stock took a more pronounced tumble on the PCE print, with the S&P 500 and Nasdaq Composite Index down 1.4% and 1.7%, respectively at the time of writing.
Related: Bitcoin must leverage $1T central bank liquidity to beat sellers — Research
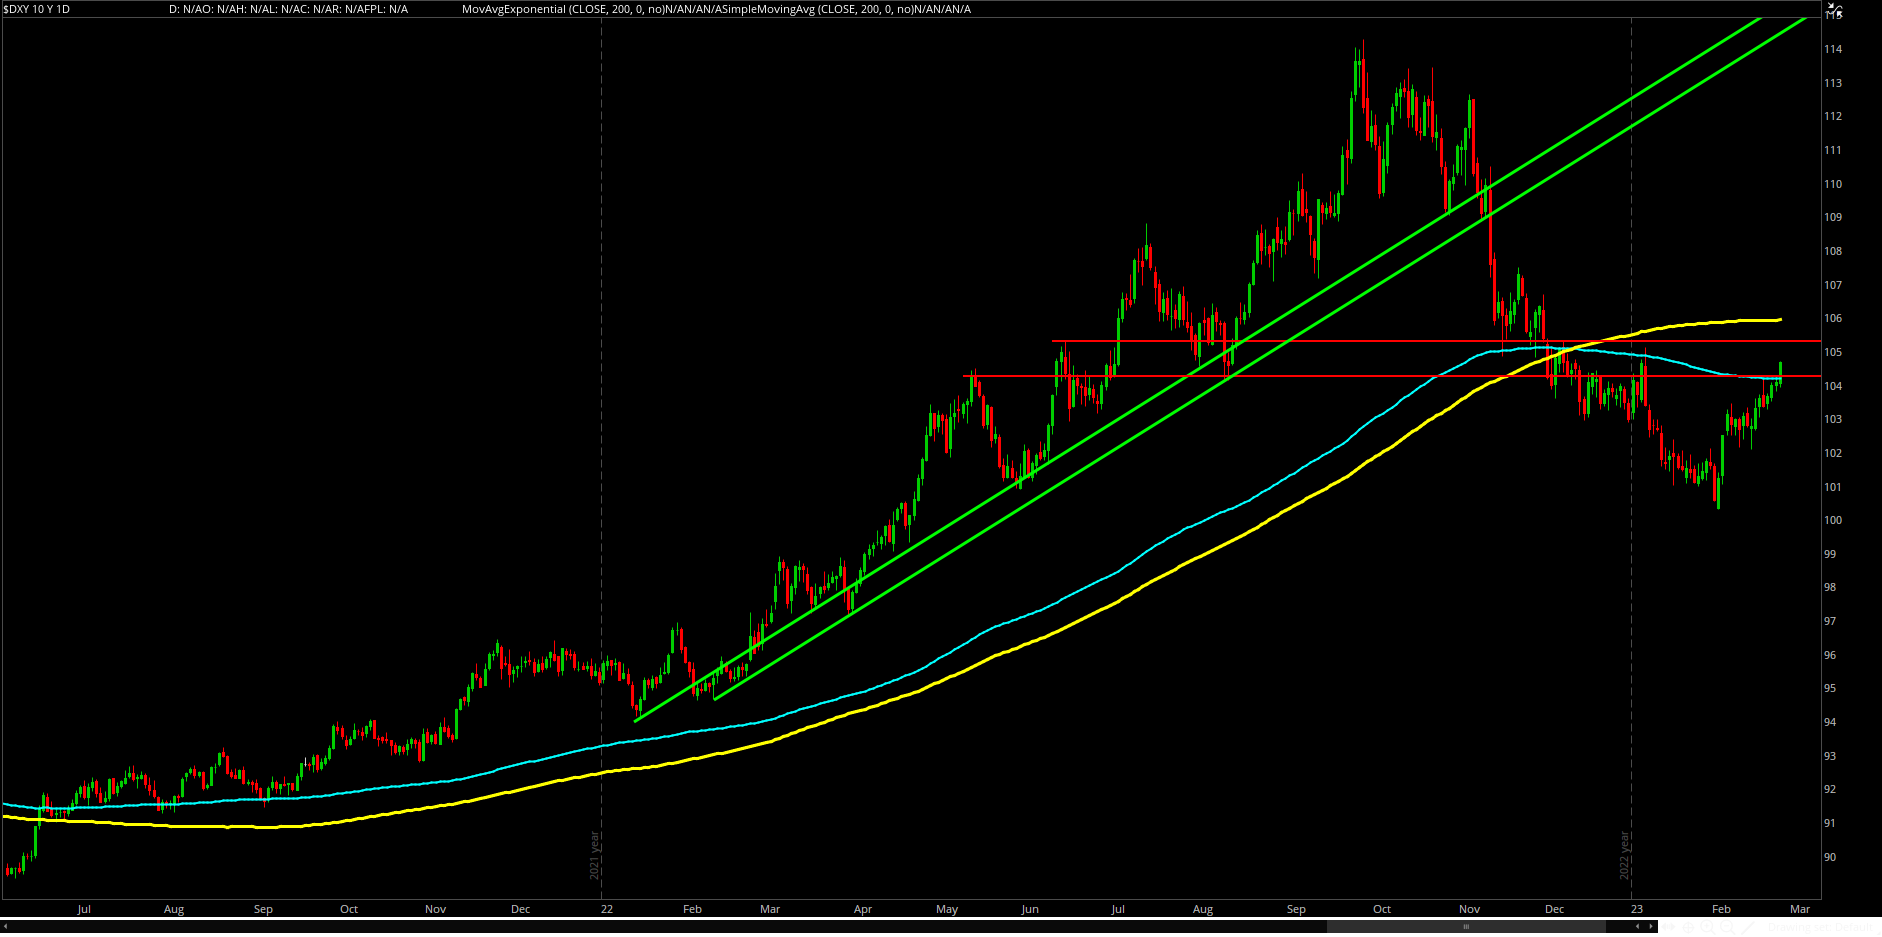
A welcome boost was had by the U.S. dollar index (DXY), which climbed to 105.3 on the day, its highest since Jan. 6.
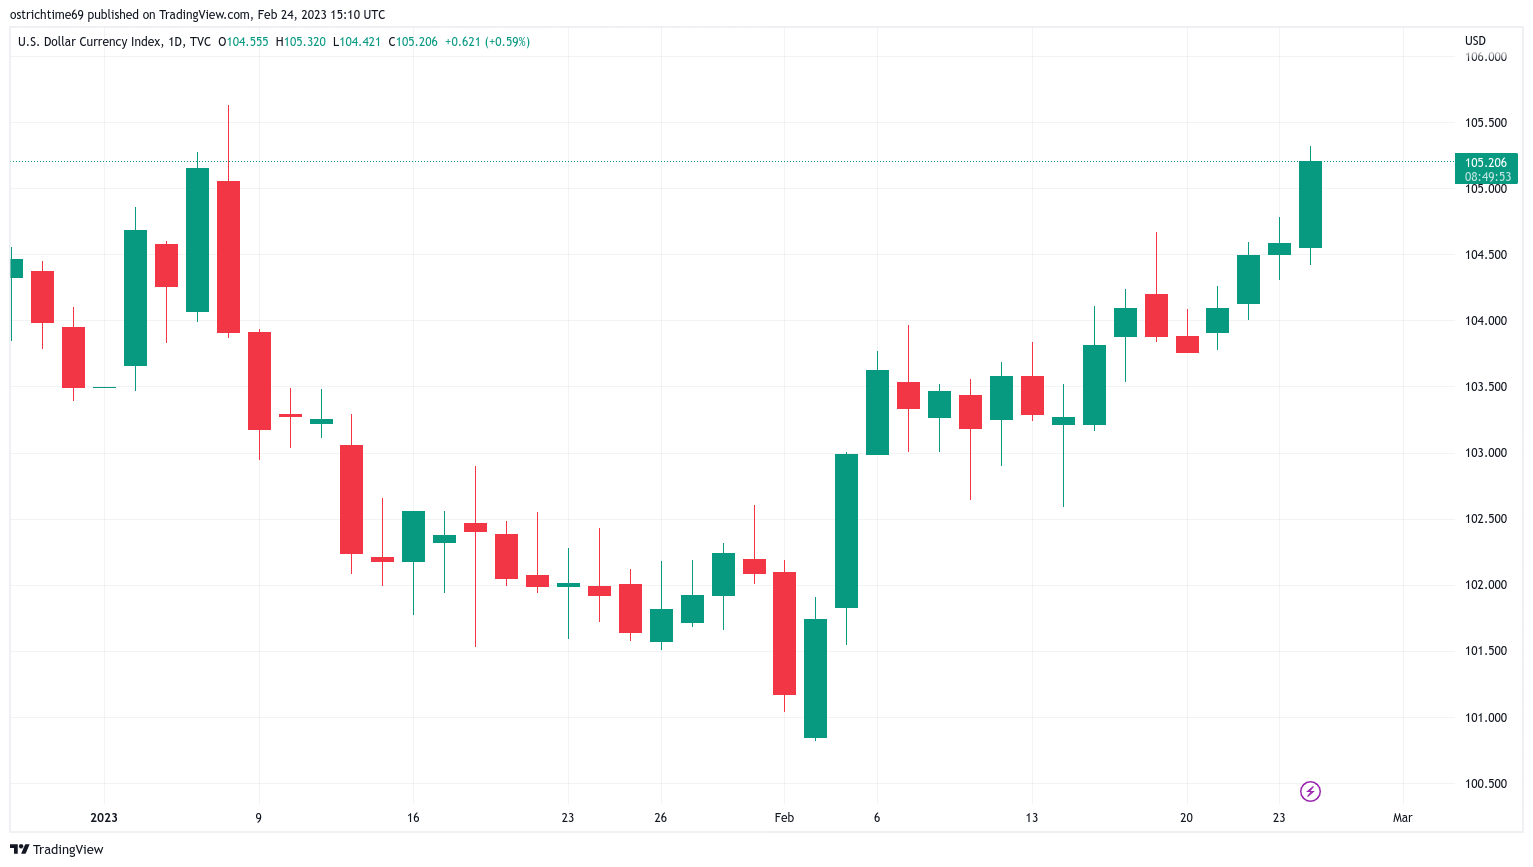
DXY weakness had characterized much of the January crypto comeback, this reversing in February in line with increased difficulty faced by Bitcoin bulls keen to hold on to 50%+ gains.
“The U.S. Dollar Index DXY moves further into the 200-day moving average cloud,” Caleb Franzen, senior market analyst at Cubic Analytics, wrote in part of a Twitter summary.
Franzen added that DXY “could see more upside within this range, but the entire range is potential resistance.”
The views, thoughts and opinions expressed here are the authors’ alone and do not necessarily reflect or represent the views and opinions of Cointelegraph.

