On April 4, the U.S. dollar index (DXY), which measures the greenback’s performance versus the basket of six leading foreign currencies, dropped by 0.5% after demand for workers in the world’s largest economy declined.
BTC price eye breakout with dollar at 2-month lows
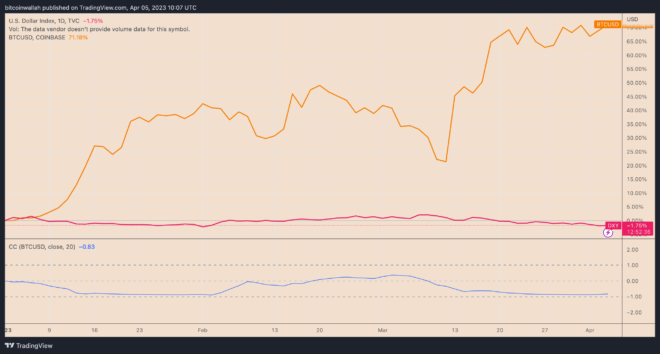
Bitcoin (BTC) has grown 3.5% since to around $28,800, continuing its extremely negative correlation with the dollar. The BTC/USD pair now eyes a breakout at $30,000, a psychological resistance level, due to hopes that the greenback will weaken further in 2023.
Meanwhile, the February Job Openings and Labor Turnover Survey (JOLTS) showed that the number of official job vacancies dropped below 10 million for the first time since May 2021.
In other words, while two jobs were available for each unemployed person at some point last year, there are now just 1.67.
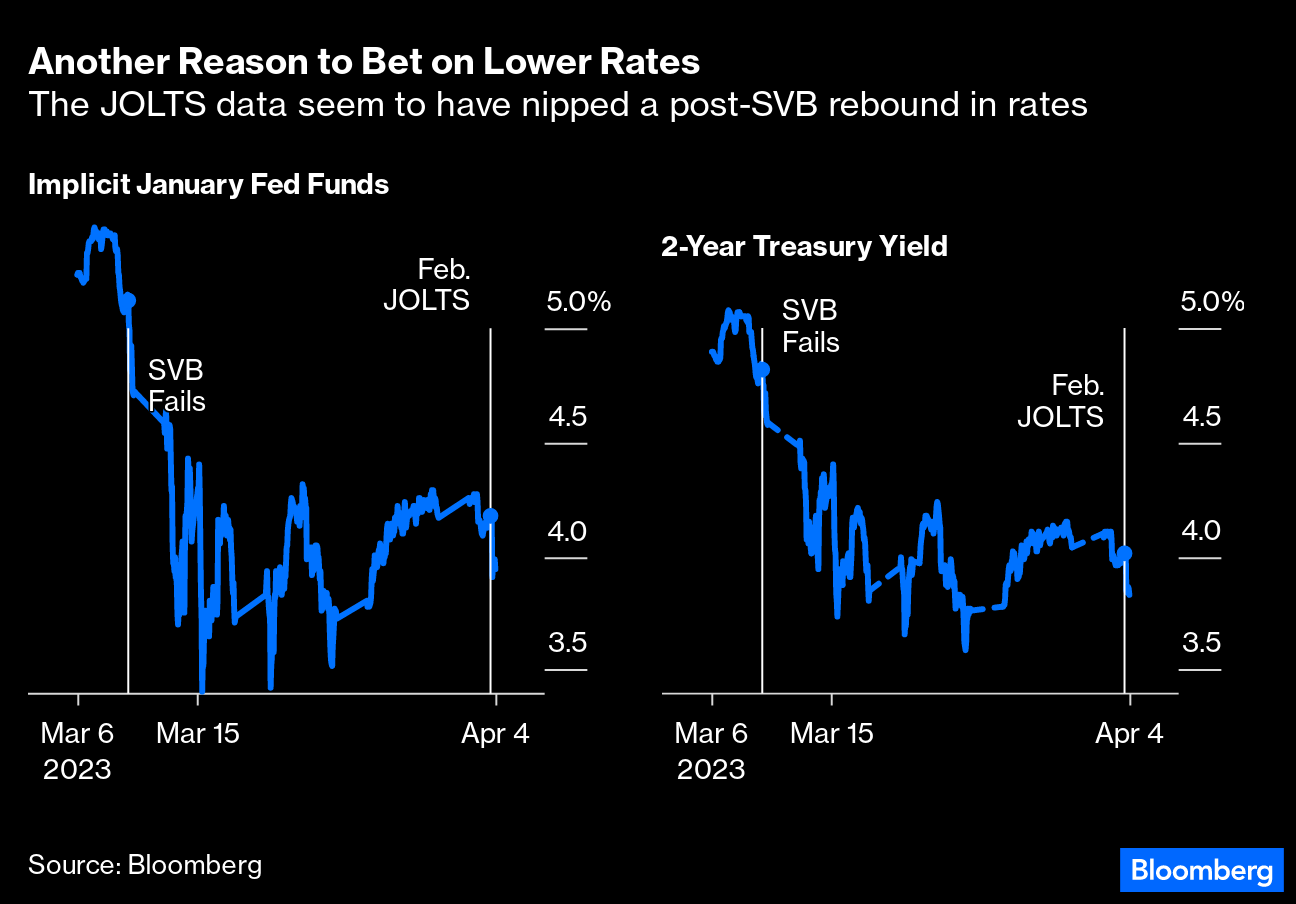
Interestingly, the implicit federal funds rate for January 2024 declined after the latest JOLTS data, in similar fashion amid March’s bank failures.
The rate expectations are now around 4% compared to about 5% before the banking crisis, suggesting the market expects the Federal Reserve to stop, if not reverse, its interest rate hike program.

Worth noting is that the JOLTS readings are backward-looking, meaning the latest data does not include March’s sudden wave of bank failures and well-publicized layoffs at McDonald’s, Walmart, and across the technology companies, including Amazon and Apple.
Thus, the market is likely to see even worse JOLTS data in the next few months. This may also line up with the next Federal Open Market Committee meeting in May, prompting a dovish response, as a Reuter poll of forex strategists anticipates.
Lower rates should pressure the dollar downward and, in turn, Bitcoin higher, as long as their traditionally-inverse price correlation remains.
Dollar $DXY looks fundamentally worse and worse for each year that goes by. Last #crypto bull run we didn’t really have a proper narrative, but for the next we will. Everything is alligning for a monster run after 2023
— Mac (@MacnBTC) April 3, 2023
Bitcoin price painting bullish continuation pattern
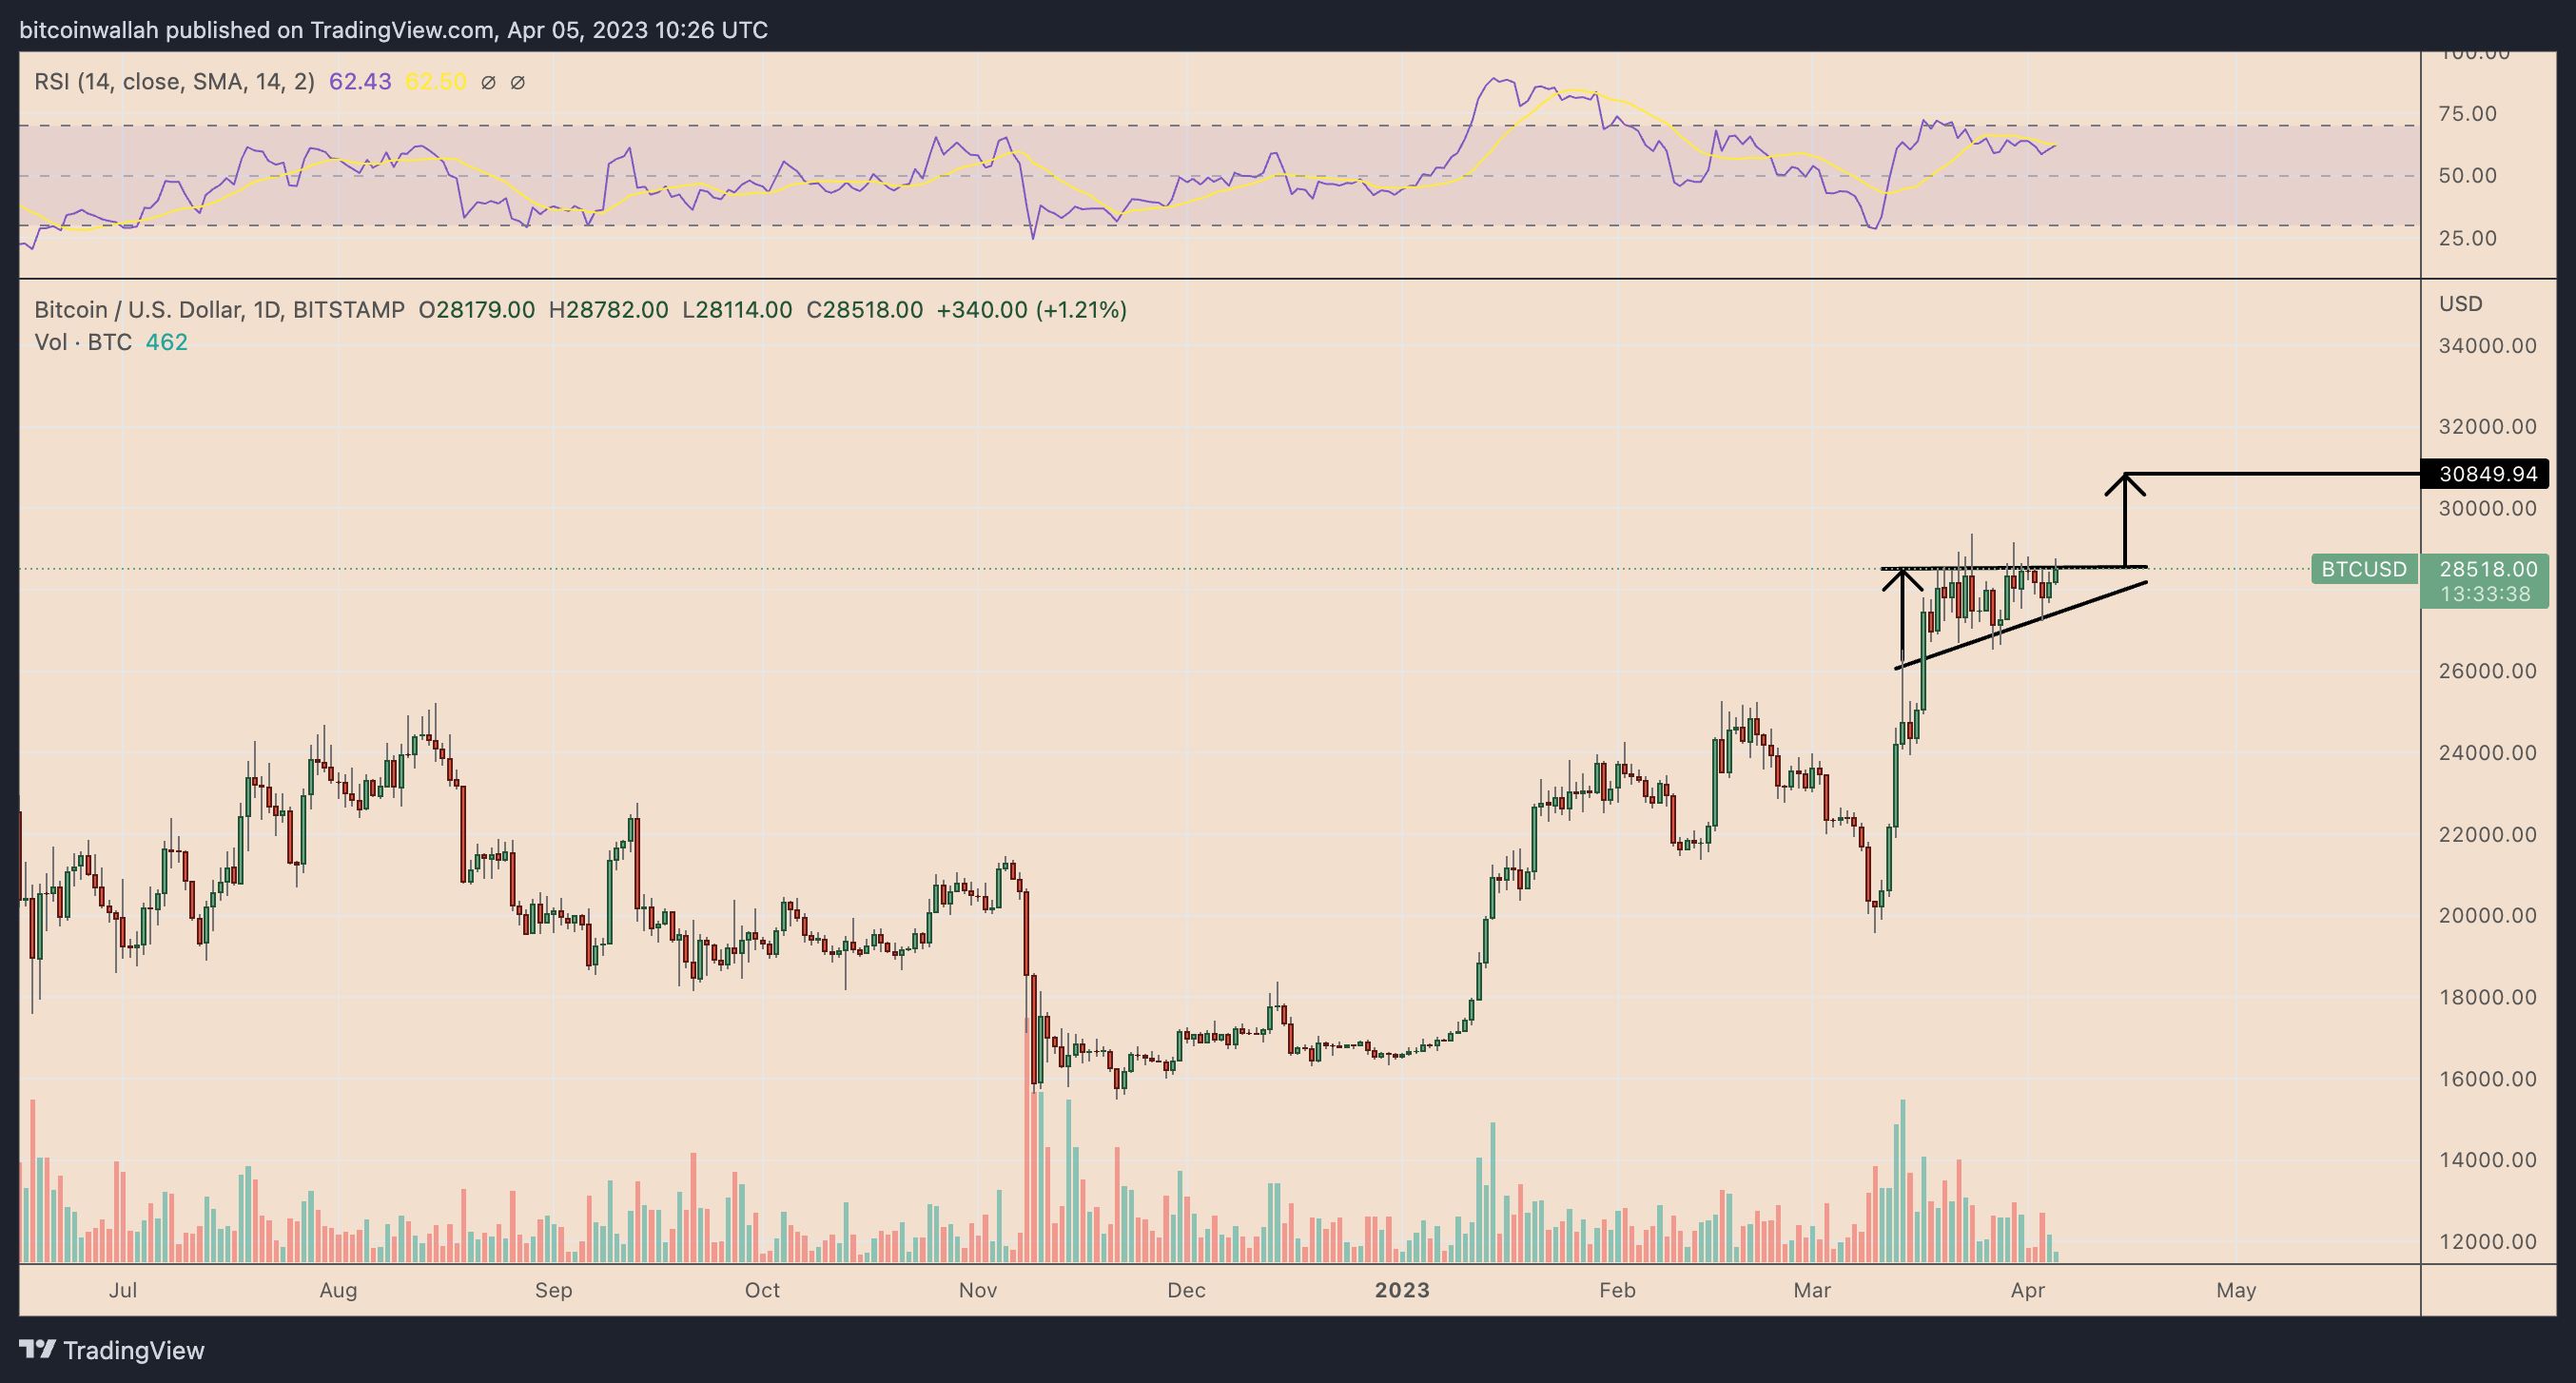
From a technical perspective, Bitcoin price eyes an extended price rally in April as it paints an ascending triangle pattern.
Related: Bitcoin breakout ‘matter of time’ says analysis with BTC price at $28K
An ascending triangle is a bullish continuation pattern that appears when the price trends between a horizontal trendline resistance and a rising trendline support.
It completes when the price breaks out of the triangle in the direction of the previous trend and rises by as much as the triangle’s maximum height.

Applying the scenario on the ongoing BTC price trend brings $31,000 as its next upside target, up around 8.5% from current price levels.
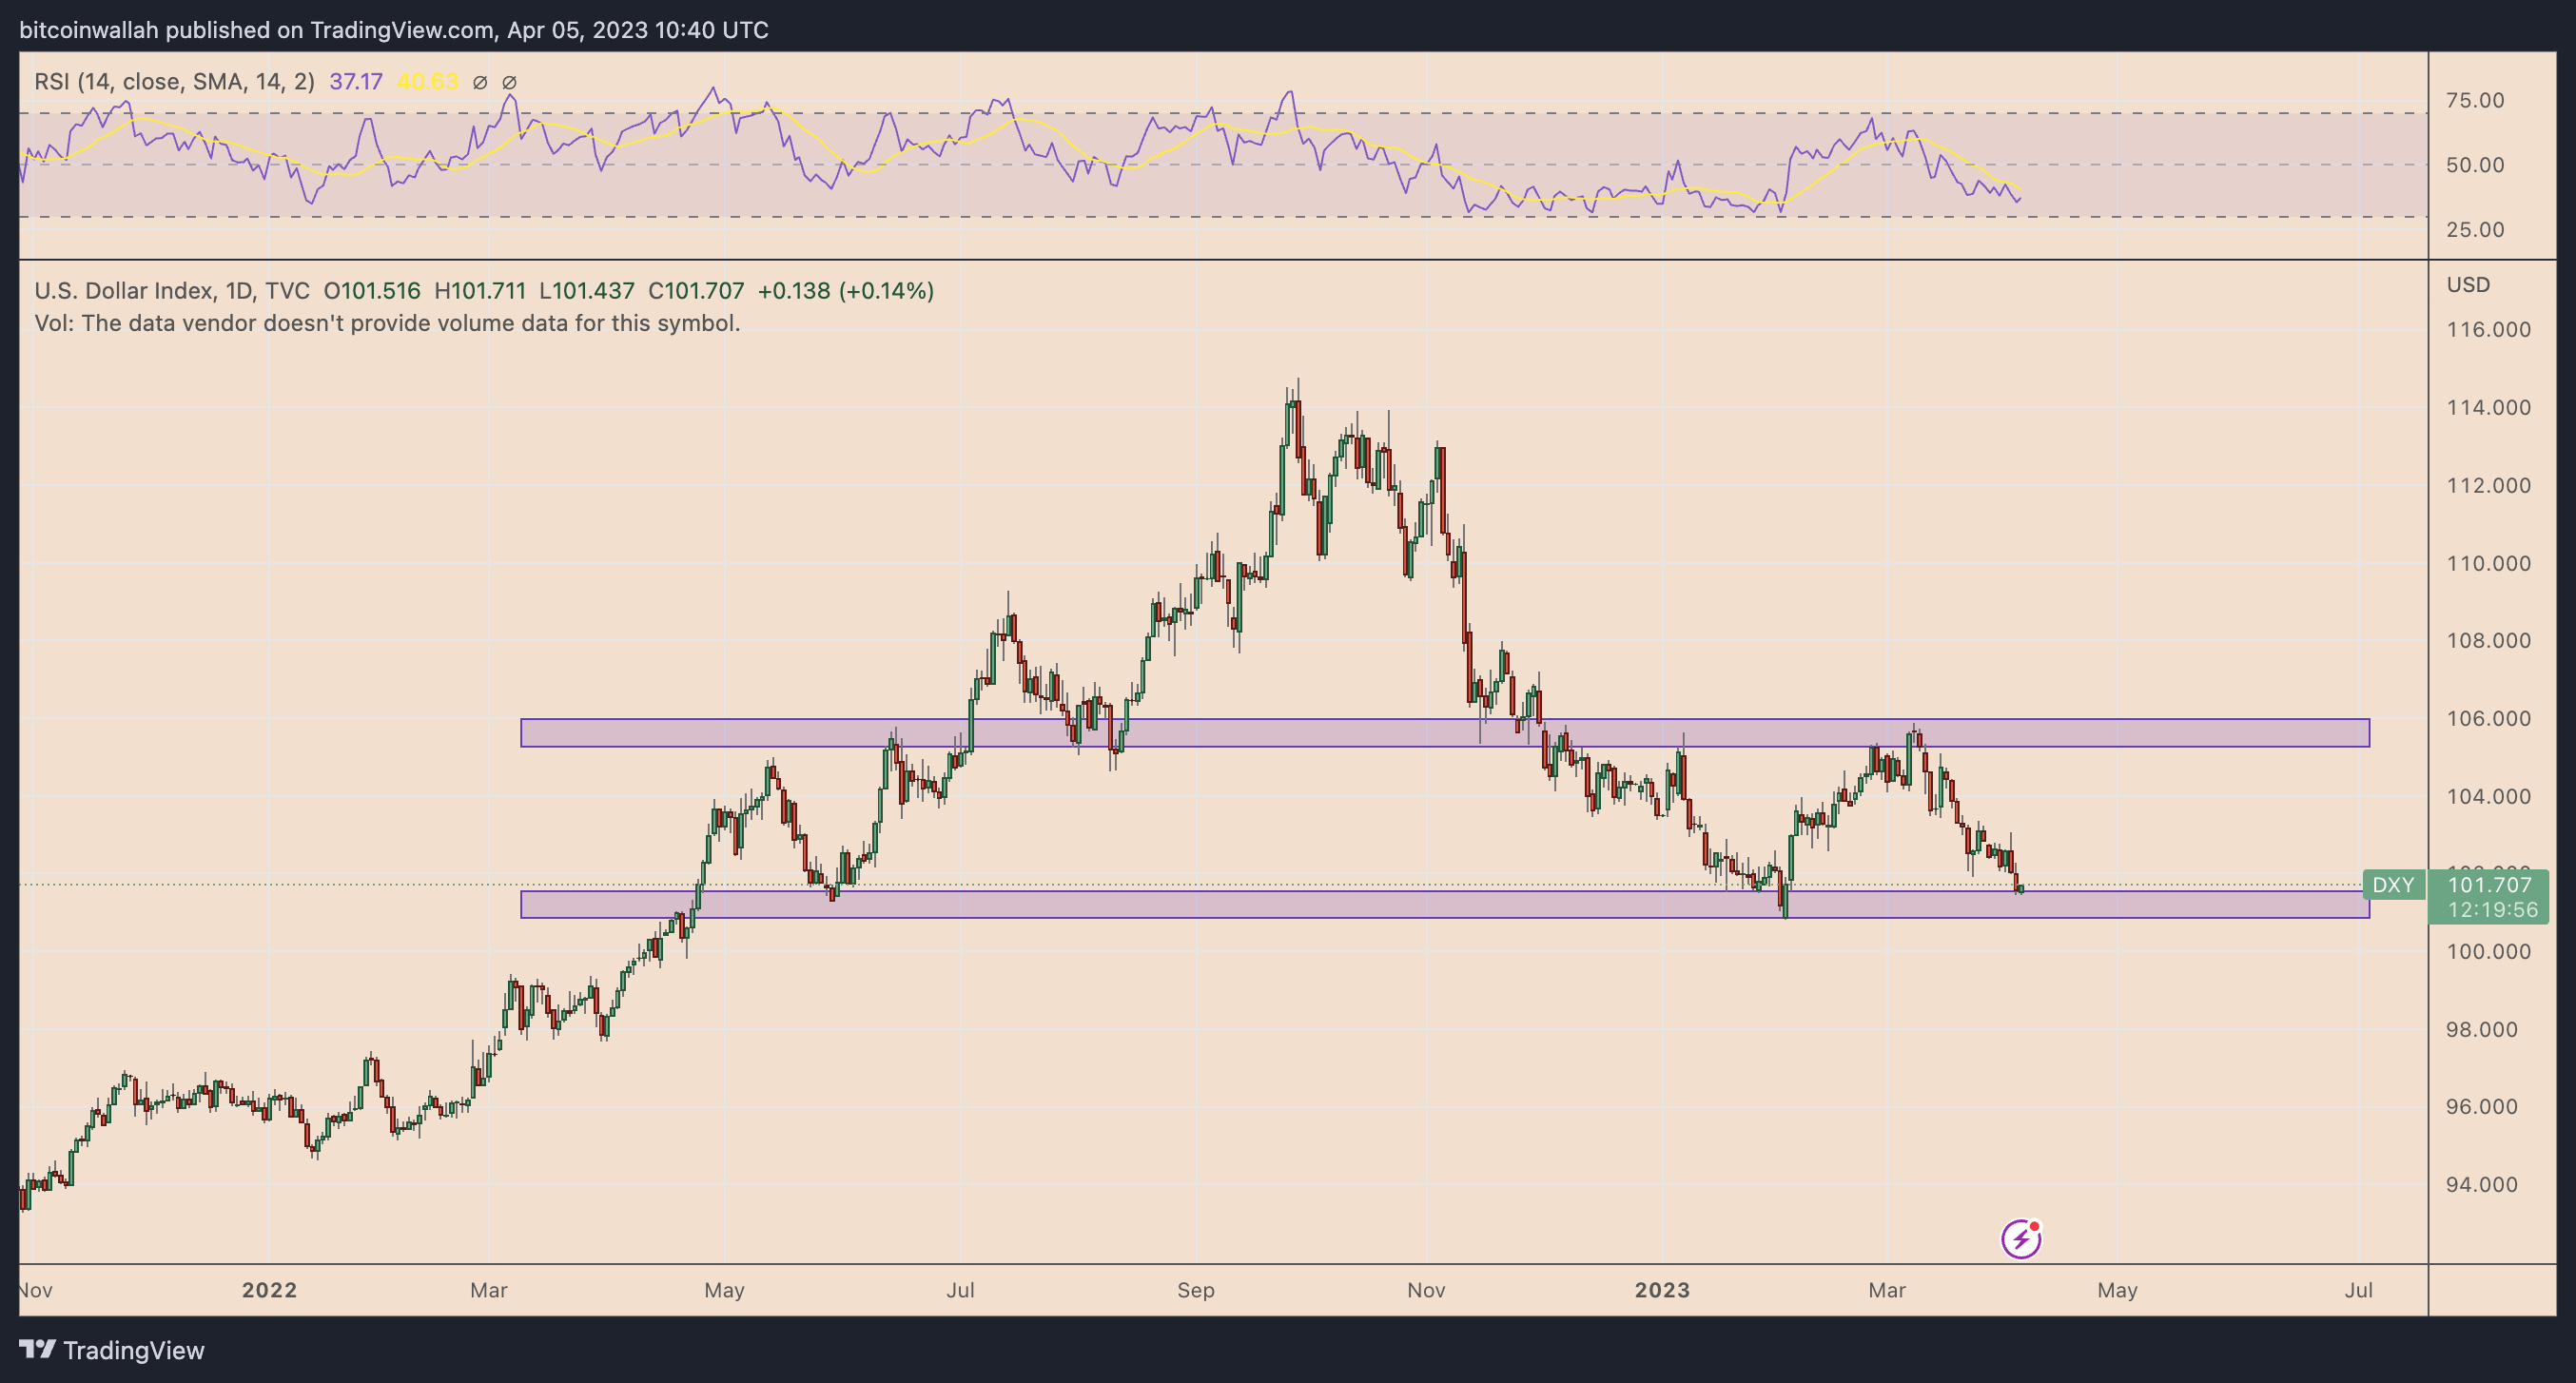
Meanwhile, the DXY has the potential to drop by another 1% in April to test the lower range of its long-standing support channel (purple) at around 100.86.

The lower rate scenario risks pushing DXY below the support channel to a new yearly low with some analysts anticipating a drop toward 95.
Ultimately, such a scenario will likely mean another leg-up for the cryptocurrency markets, and a potential $35,000 target for Bitcoin in Q2.
This article does not contain investment advice or recommendations. Every investment and trading move involves risk, and readers should conduct their own research when making a decision.


