Solana (SOL) has been experiencing some volatility this week, but analysts seem optimistic about an ‘imminent markup’ around the corner. In the past 24 hours, Solana (SOL) has registered a 10.6% increase after breaking through the $140 barrier again.
Solana Rises Above $140
January of 2022 marks the last time Solana’s native token traded above the $140 price range. On Thursday, the fifth-largest cryptocurrency by market capitalization hit a new high and followed the uptrend the crypto market is experiencing.
JUST IN: #SOLANA BROKE $140 🚀#SOL $SOL pic.twitter.com/KbHkiwm8uf
— 👑BitcoinExpert.sol👑 (@PeterAnagno) March 7, 2024
On March 5, SOL’s price spiked 7.5% after going from $132 to $142. However, the excitement about the cryptocurrency surpassing $140 was short-lived.
The price started what looked like a freefall descent that shredded 16% of the token’s price, stopping at the $119 price range. Throughout Wednesday, SOL’s price continued to move in both directions while trying to stabilize above the $128 support level. The token finished the day hovering between the $130-$132 price range.
On Thursday, Solana picked up some momentum and tested the $141 level before facing a pullback to the $135 support zone. Later, SOL broke through the $140 barrier again as the price skyrocketed to $144, increasing 6.6% in just two hours.
SOL’s price performance in the hourly chart. Source: SOLUSDT on TradingView.com
For the past hour, SOL’s price has hovered between the $140-$142 price range, briefly falling below the $140 support zone. At writing time, the cryptocurrency trades at $142.10, accounting for an increase of 10.6% in the last 24 hours and 9.5% in 7 days. In the 30-day time frame, Solana has seen a stellar price surge of 50.8%.
However, SOL seems to be experiencing a slow market activity. According to CoinMarketCap data, the daily trading volume has decreased by 37.7% in the past 24 hours to $6.4 billion.
Is A New ATH Imminent For SOL?
Pseudonym crypto trader and analyst Bluntz previously forecasted Solana’s next leg up to be around the corner, saying that “the revenge pump is close.” Today, the trader reaffirmed that stance on an X (formerly Twitter) post.
Right before the price hit $140, the analyst posted two charts displaying SOL’s pair with BTC and USDT. The trader highlighted the patterns he previously used to make a prediction in February.
feels like a $SOL markup is imminent. https://t.co/suhs2SZroC pic.twitter.com/RJSlovIzhr
— Bluntz (@Bluntz_Capital) March 7, 2024
Based on the “nice simple ABC zigzag” with its BTC pair and the “nice sideways accumulation wave 4” with its USDT pair, the analyst considers that an SOL markup is “imminent.”
Related Reading: Ethereum Recovers From Dip: ETH Hits $3,900 For The First Time In Two Years
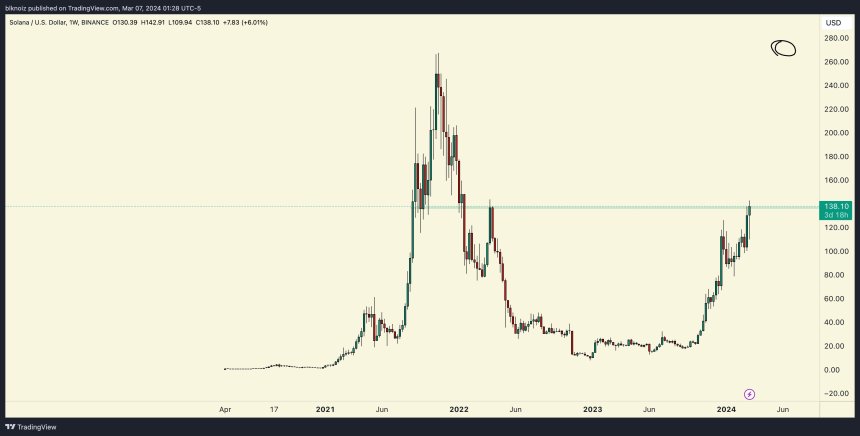
Moreover, crypto trader Ansem suggested that Solana’s new all-time high might be closer than expected. In an X post, the trader shared a chart exhibiting the price performance of the cryptocurrency.
Solana's performance in the all-time chart. Source: @blknoiz06 on X.com
The chart above shows that SOL’s price of $138 was first achieved in early September 2021. Approximately 60 days later, Solana reached its all-time high of $260. If history repeats itself, according to the trader’s post, we could see “Solana’s new all-time high in less than 60 days.”
Featured image from Unsplash.com, Chart from TradingView.com
Disclaimer: The article is provided for educational purposes only. It does not represent the opinions of NewsBTC on whether to buy, sell or hold any investments and naturally investing carries risks. You are advised to conduct your own research before making any investment decisions. Use information provided on this website entirely at your own risk.


