Leading on-chain analyst James Check, popularly known as Checkmatey, has recently delved into the intricacies of Bitcoin’s market dynamics, offering a detailed on-chain data analysis that sheds light on the forces driving Bitcoin prices. His latest insights highlight a period he describes as “Quiet and Trending,” suggesting a robust underpinning despite significant sell-side pressures and shifts in volatility.
Bitcoin Follows The Stair-Stepping Rally-Consolidation-Rally Pattern
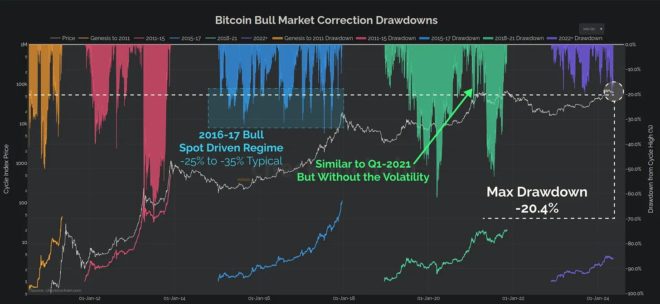
Since December, Bitcoin has experienced substantial sell-side pressure, with over 1.5 million BTC being sold. “Around 30% of this came out of GBTC, but the rest of it was good old fashioned profit taking,” Check explains.
Despite such substantial market sales, Bitcoin has demonstrated resilience with a relatively modest price correction of just -20%. This suggests that the foundational support levels for Bitcoin are stronger than what surface-level market movements might imply.
A striking aspect of Check’s analysis is the transformation in Bitcoin’s volatility profile. “The overall realized volatility profile for Bitcoin is half what it was in 2021, and 3x smaller than 2017,” states Check. This trend indicates a growing maturity within the Bitcoin market, reflecting its evolution into a more stable asset over time compared to its early years.
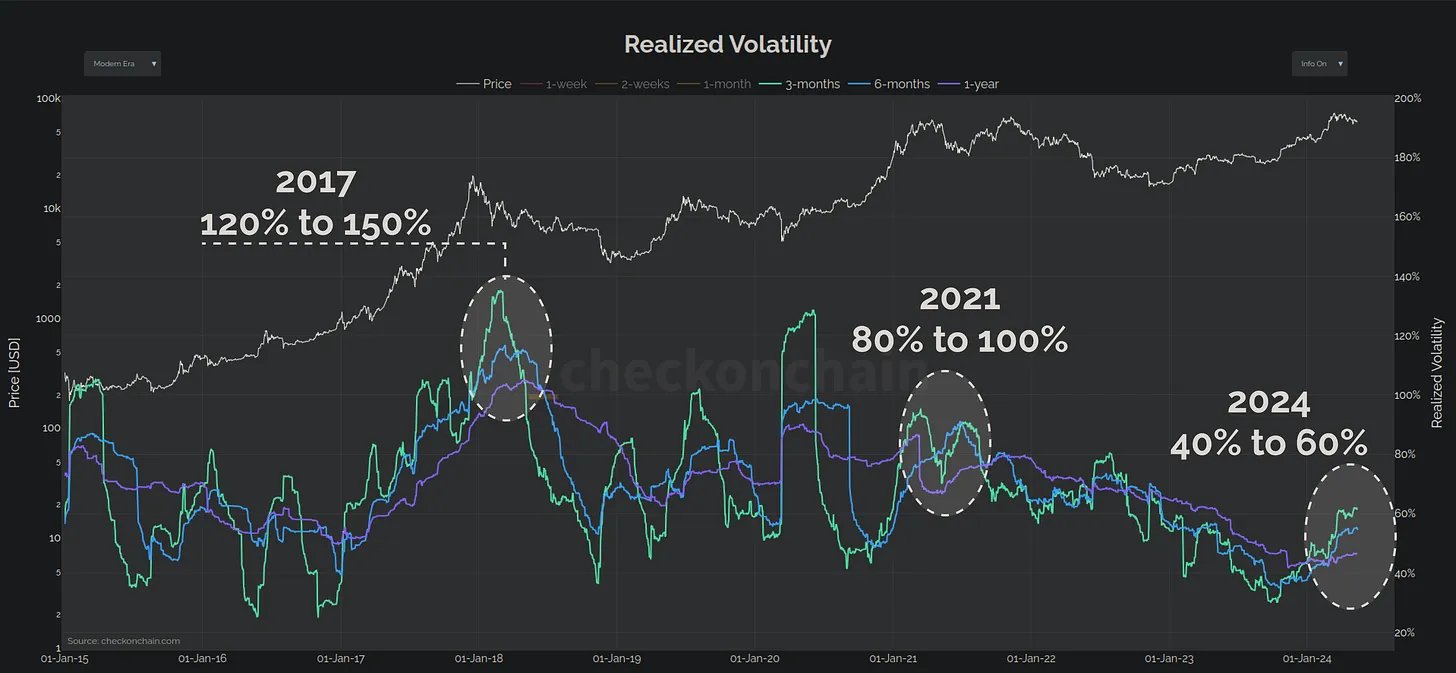
Check counters the typical narrative surrounding Bitcoin’s volatility: “What a lot of people forget however is that Bitcoin is volatile to the upside. Volatility to the upside is good!” He posits that the current increment in volatility is moderate and suggests that the market is still in the early phases of a bull run, rather than nearing its end.
Related Reading
A critical tool in Check’s analysis is the Short-Term Holder MVRV (STH-MVRV) Ratio, which he uses to gauge market sentiment and phases. According to Check, this ratio consistently finds support at 1.0 and resistance at 1.4 during stable uptrends. Stability is maintained as long as the ratio remains within these bounds. “Only when it breaks above this ceiling do things become unstable,” Check notes, which could signal a transition to bearish conditions.
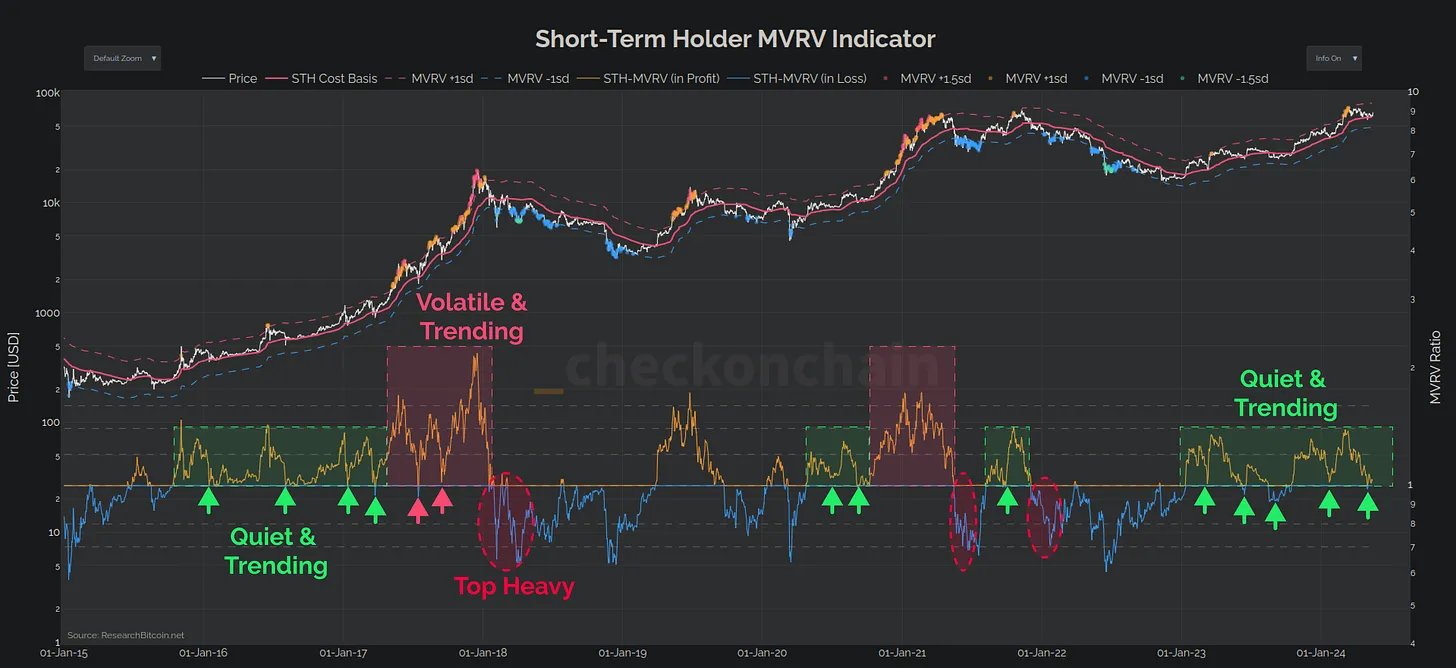
Despite the sell-off that brought Bitcoin down to $57k, Check observes that this has not significantly dented the profitability of short-term holders. “The magnitude of Unrealised Loss was very much in line with bull market corrections, calming fears of a top-heavy market.”
Related Reading
He further highlights that several of the local top buyers panic sold their Bitcoin at the lows, an action he interprets as beneficial for the correction phase, serving to stabilize the market by shaking out weak hands.
Expanding his analysis, Check refutes the criticism that Bitcoin’s volatility makes it a less viable asset. He points to a chart comparison of Bitcoin’s 30-day volatility against top-performing US stocks, showing that Bitcoin’s volatility is well within a manageable range.
Furthermore, he discusses the lower realized volatility of the SPY index, attributing it to the “out sized performance of the Magnificent-7,” which is counterbalanced by the poorer performance of the other components.
By highlighting the structural aspects of the current “Quiet and Trending” market phase, Check offers a refined perspective on how Bitcoin is navigating its maturation pathway, balancing between its speculative origins and its potential as a mainstream financial asset.
He concludes, “Overall, the Bitcoin uptrend in 2023-24 looks fairly structured, following stair-stepping rally-consolidation-rally pattern. However, as the charts above show, volatility tends to pick up during a consolidation, and that can lead to instability.”
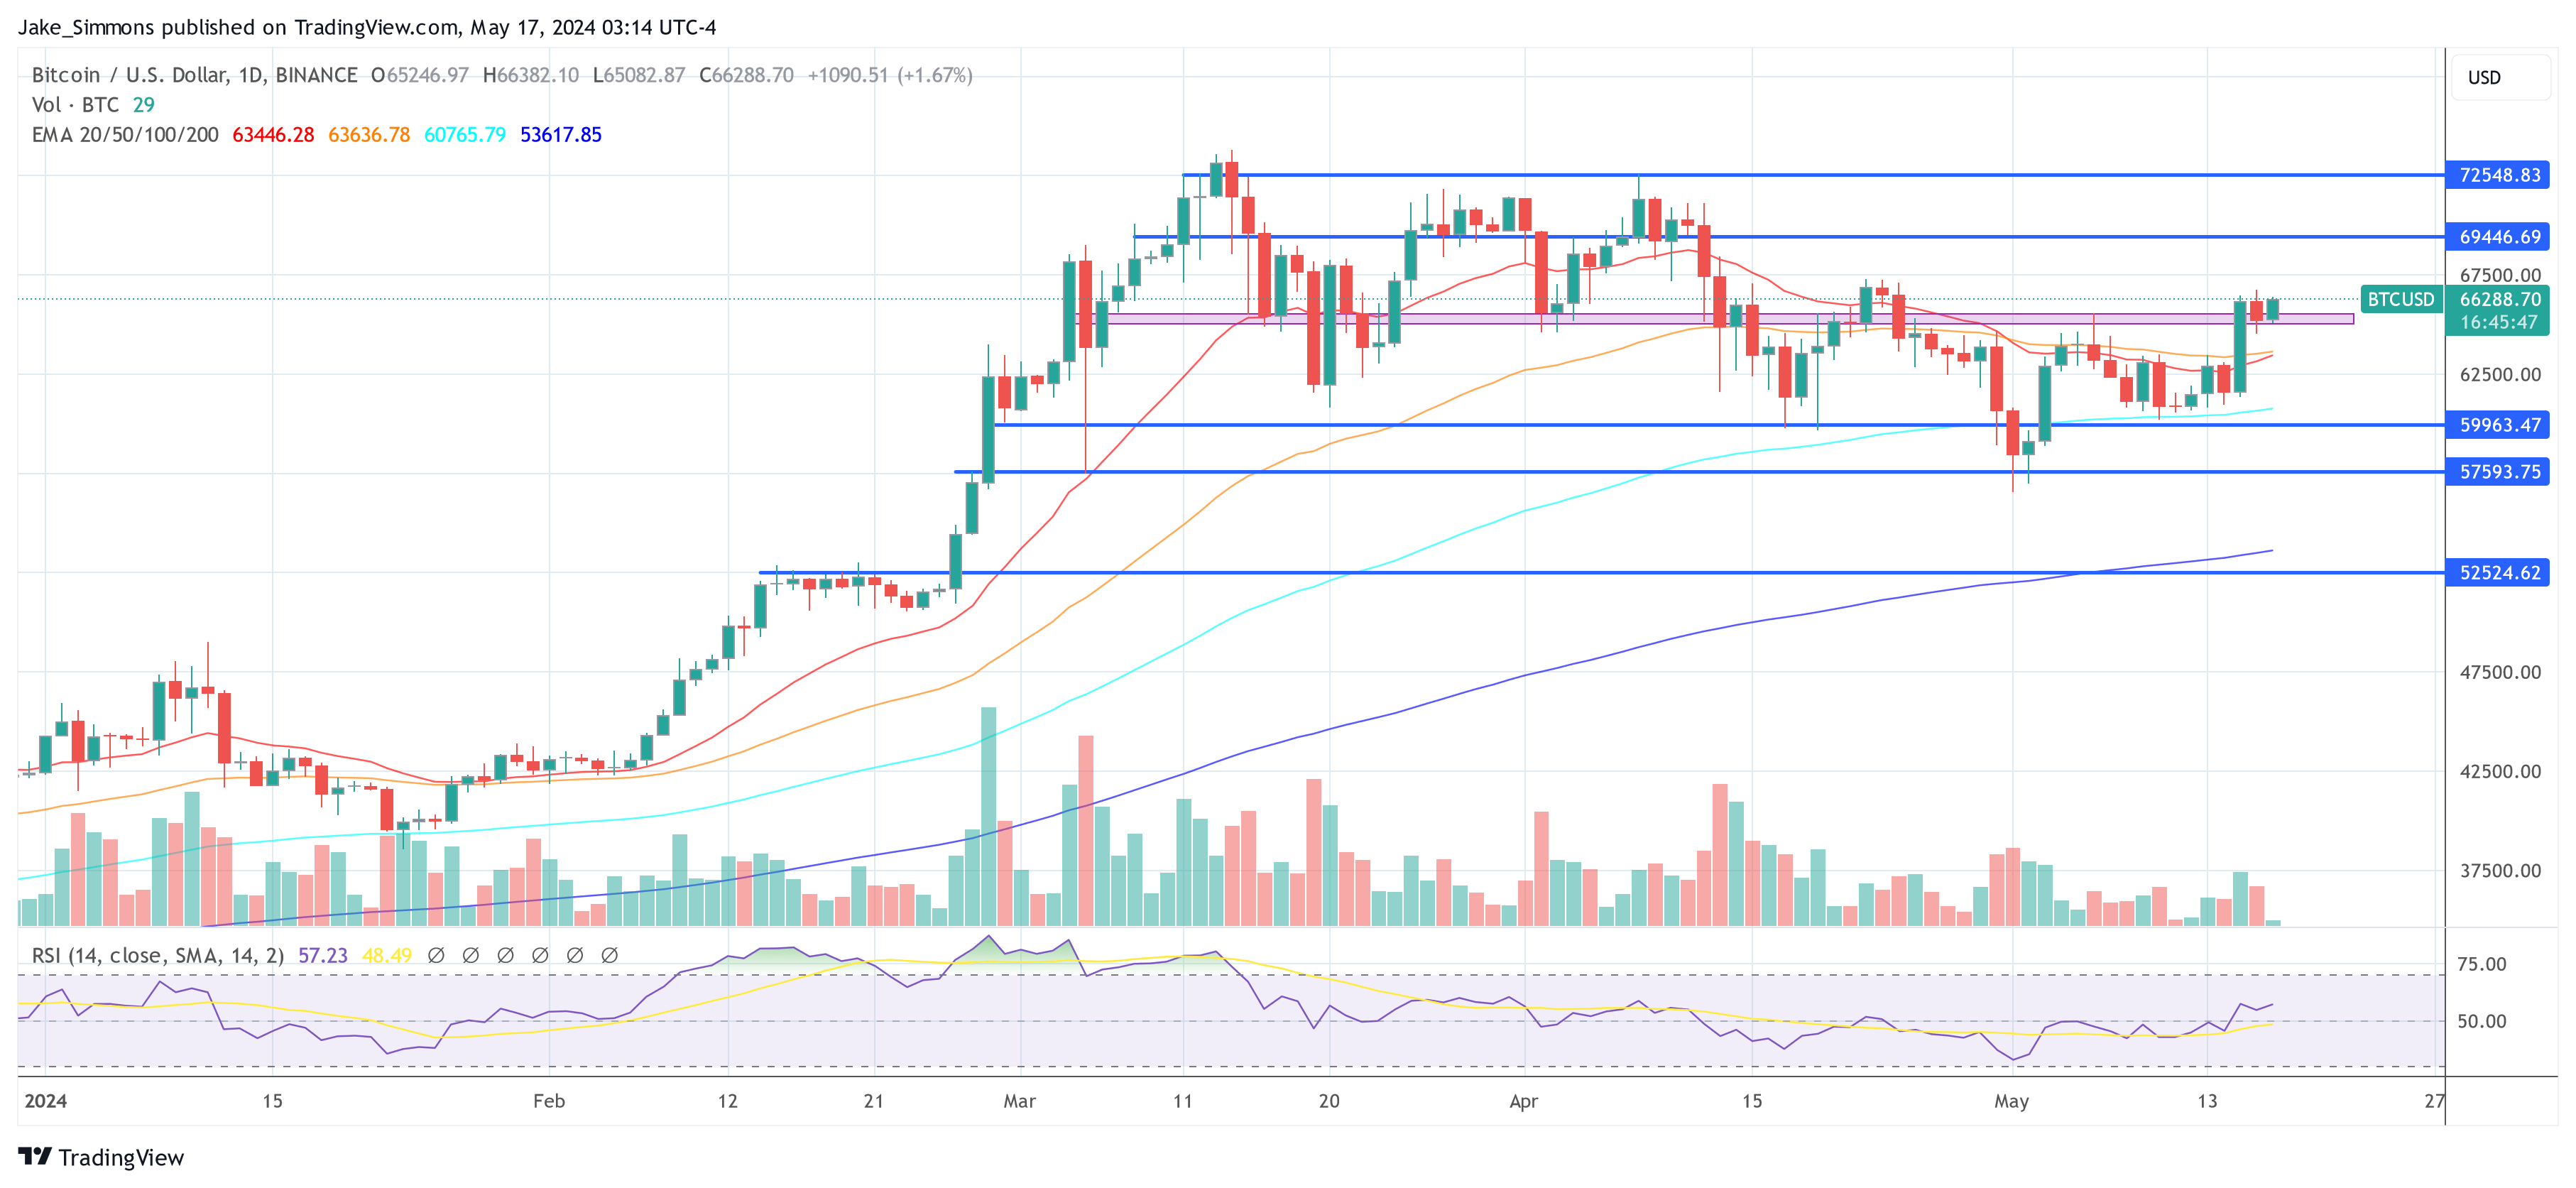
At press time, BTC traded at $66,288.
Featured image created with DALL·E, chart from TradingView.com


