Crypto analyst JT (@JTheretohelp1) has provided a technical analysis indicating a pivotal movement for XRP before November this year. His analysis, shared on social media platform X, presents a detailed view of the XRP price in the 2-month chart (XRP/USD) constrained within a converging triangular formation, signaling an impending breakout.
Why A Decision Looms Before November For XRP
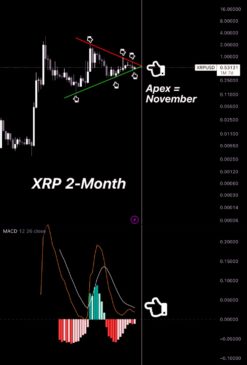
JT stated: “Love it or hate it, something BIG is going to happen with XRP before November.” The triangular pattern, outlined by a descending red resistance line and an ascending green support line, shows the XRP price action becoming increasingly constrained.
The resistance line, touched at points identified by red arrows, has marked significant downturns in the asset’s price. Similarly, the ascending support line, indicated by green arrows, shows where the price has found rising support levels. This triangle is predicted to culminate at its apex in November, a critical juncture that could define the future trajectory of XRP.
Related Reading
Price levels within this triangular formation have fluctuated, with the resistance peak in the penultimate 2 month candle and support level touched with the current candle. The convergence of these trendlines at the apex implies a decision point where volatility is expected to increase, leading to a potential breakout or breakdown.
Further technical insight is gleaned from the Moving Average Convergence Divergence (MACD) indicator, displayed at the bottom of the chart. This momentum indicator, comprising a MACD line (orange) and a signal line (blue), helps determine market direction and momentum shifts.
Currently, the MACD line is approaching a crossover with the signal line, a critical event often interpreted as a bullish signal if the MACD line crosses above. Notably, the histogram, representing the difference between the MACD and signal lines, is transitioning from red to green bars, indicating a reduction in bearish momentum and a potential shift towards bullish sentiment.
Related Reading
The MACD’s behavior in relation to its centerline (zero value on the Y-axis of the MACD plot) will be crucial. A cross above the centerline can confirm a shift to bullish momentum, coinciding with the triangle’s apex and potentially catalyzing the anticipated breakout.
“One of the longest running triangles in the crypto market is approaching a date with destiny @ its apex. That apex happens to end in November (white line). If the MACD can turn up, Boom,” JT concluded.
In summary, JT’s analysis of XRP suggests a significant market movement tied to the apex of a longstanding triangular pattern by November. The alignment of MACD signals and the tightening price action within the triangle provide a compelling narrative for traders and investors. As such, monitoring these two indicators will be essential for those involved in the XRP market, as the resolution of this pattern could signal major price movements.
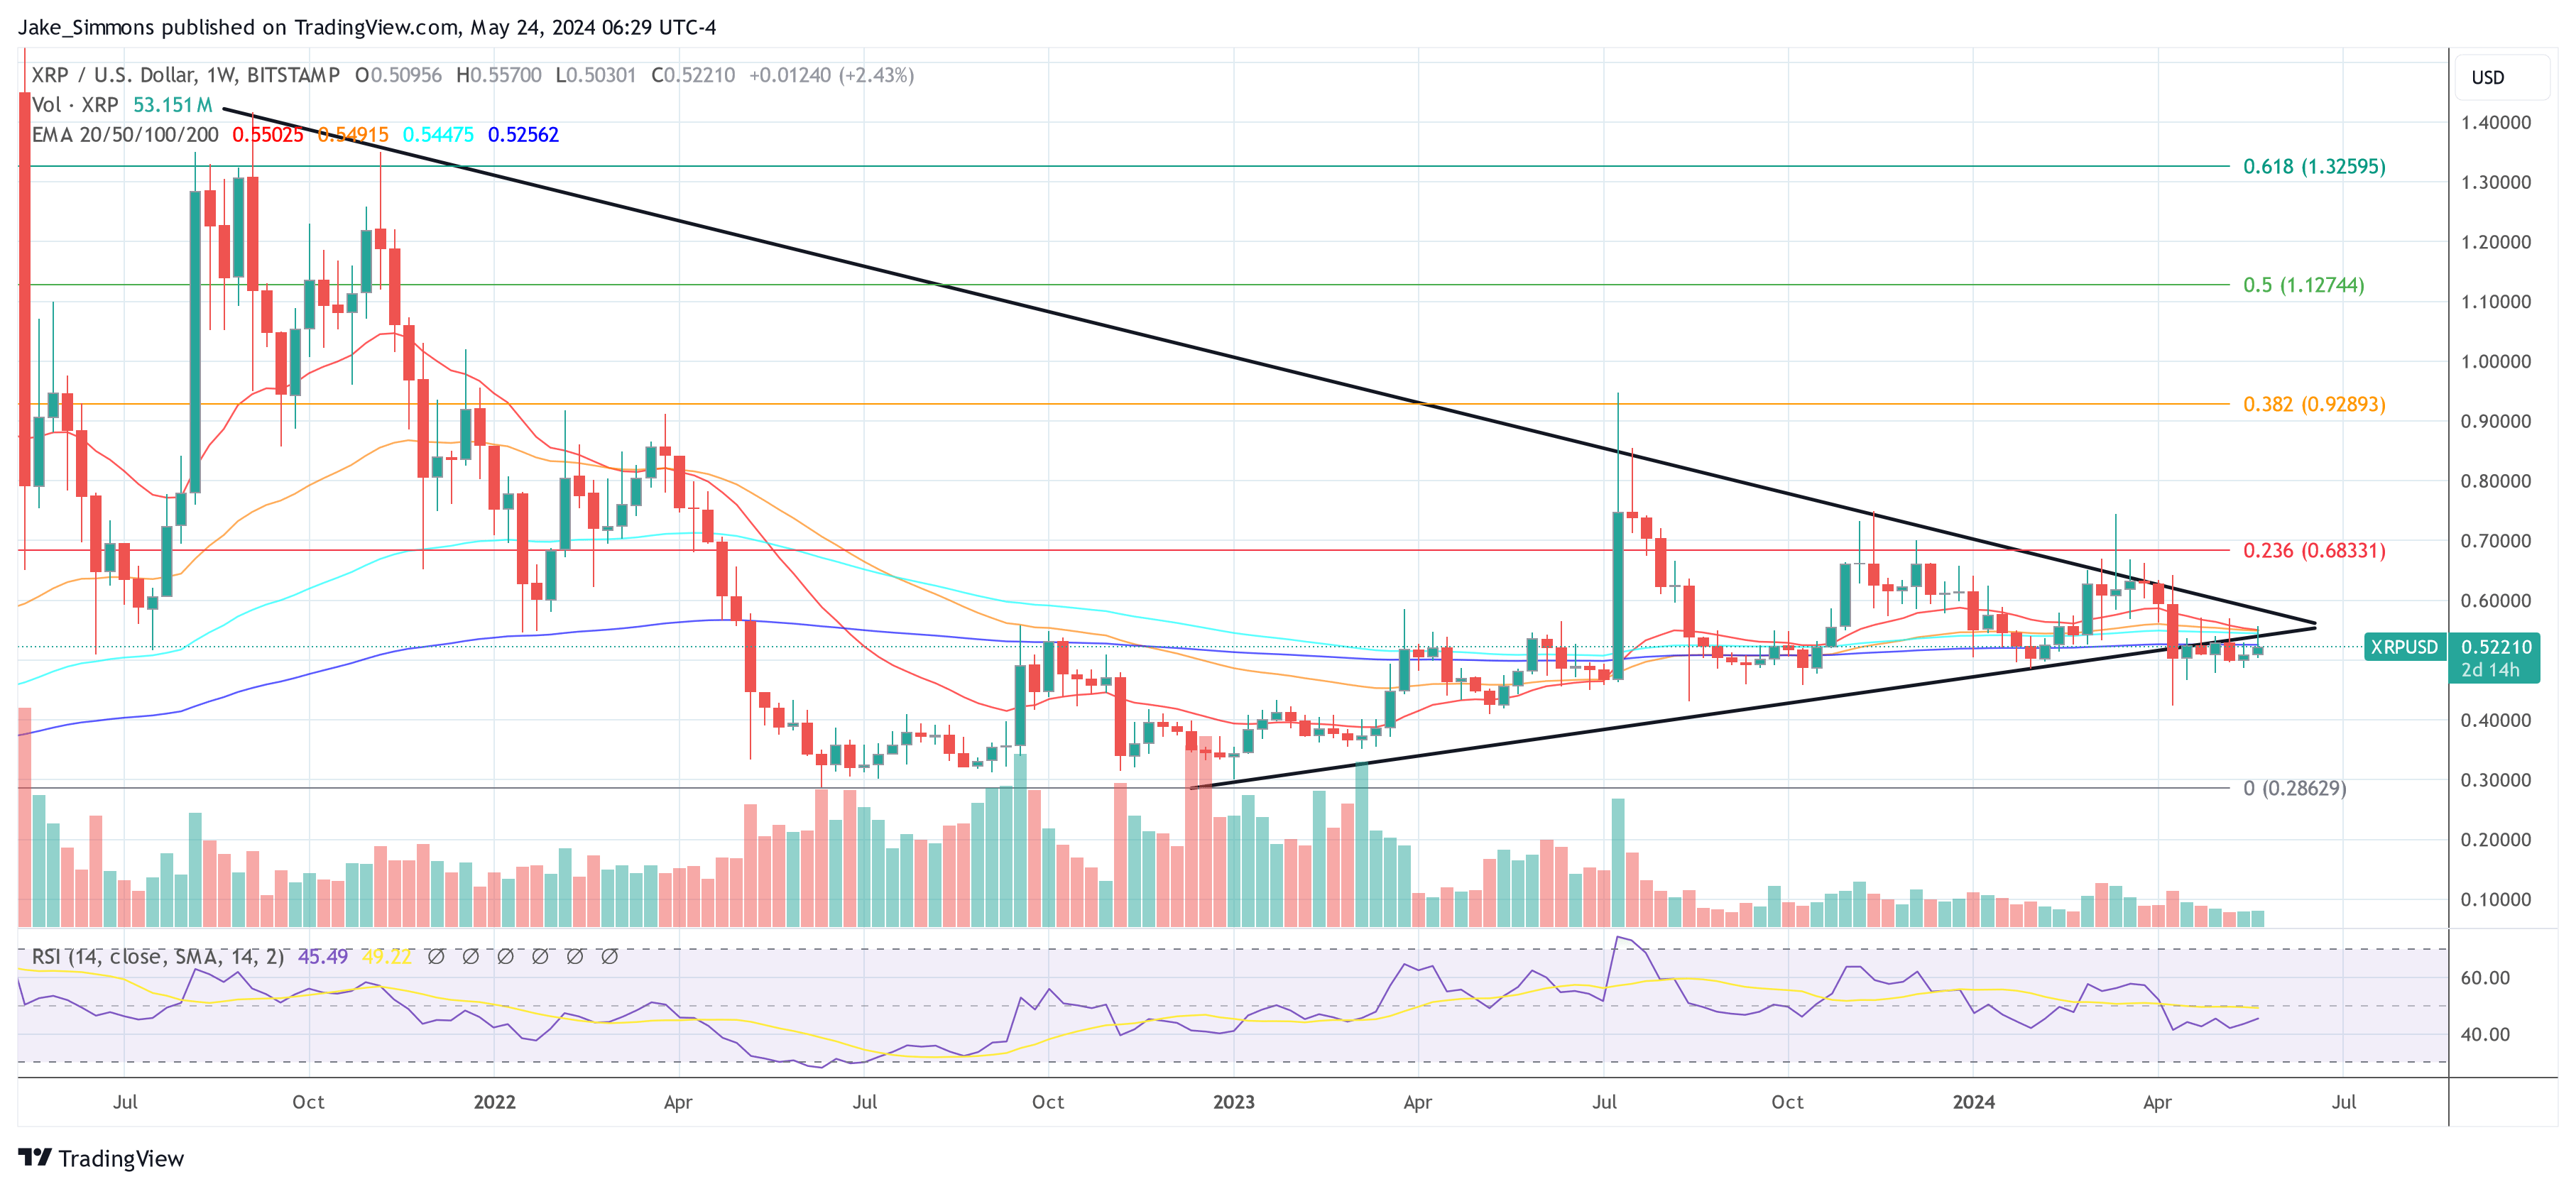
At press time, XRP price stood at $0.5221.

Featured image created with DALL·E, chart from TradingView.com


