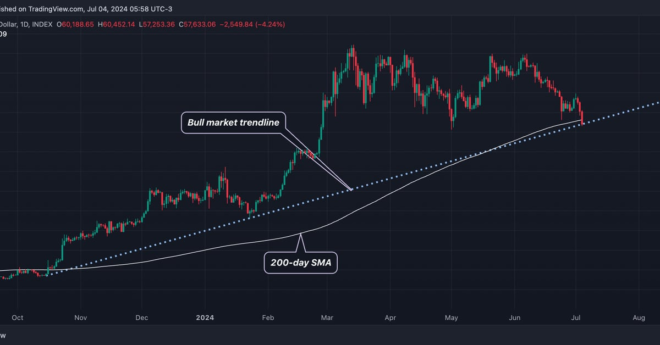
Markets that consistently trade below the 200-day SMA are said to be in a downtrend, while those trading above the average are bullish. BTC rose past the 200-day SMA in October, when the average value was $28,000. The breakout – fueled by expectations for a spot bitcoin ETF in the U.S. – paved the way for a sharp rally to record highs above $70,000 by March.
Related posts
-
Bitcoin Rally Benefits From US Buyers
Este artículo también está disponible en español. Bitcoin has surged past the $99,800 mark, setting another... -
Ethereum Price Repeats Bullish ‘Megaphone’ Pattern From 2017
Este artículo también está disponible en español. The Ethereum price has formed a key technical pattern... -
Mad Money’s Jim Cramer Prefers BTC to MSTR — Tells Investors: ‘Own Bitcoin. That’s a Winner’
Mad Money host Jim Cramer has picked bitcoin over Microstrategy’s stock (MSTR), calling the cryptocurrency “a...