
Chainlink (LINK) has surged over 10% in the past few hours, pushing its price to $11.39 at the time of writing. This significant gain comes after two weeks of sideways consolidation, signaling a potential shift in momentum.
Related Reading
As LINK rallies, data from Santiment, a leading crypto data intelligence platform, reveals that some daily traders are already taking profits, capitalizing on the recent price increase.
This profit-taking activity highlights investors’ cautious optimism as LINK’s price gains momentum and reaches technical resistance in the 4-hour timeframe.
LINK’s On-Chain Transaction Volume Showing Profit-Taking
LINK’s daily profit-to-loss transaction volume has reached its highest level since July 14, with the ratio at 5.986. This means there are nearly six transactions in profit for every transaction in loss, signaling that short-term holders are actively taking profits following the recent move up. Such a high ratio indicates that investors are capitalizing on a significant price increase or relief rally, locking in gains as the market tests key levels.
This profit-taking trend reveals the dynamics prevailing among traders, even as LINK’s price continues to gain momentum in the market. With the token testing local supply around the $11.40 mark, the market sentiment is one of careful anticipation. Traders are keenly aware of the delicate balance between further gains and potential pullbacks.
Investors will watch for signs of a sustained breakout or a potential reversal as LINK approaches this threshold. The outcome at this level could set the tone for LINK’s price action in the coming days, making it a critical juncture for traders and investors alike.
Technical Details: LINK Price In Critical Level
LINK is trading at $11.31 after breaking a local high of $10.83 set on August 8, confirming an uptrend on the daily time frame. The price rally paused at $11.40, right at the 4-hour (4H) 200 exponential moving average (EMA), underscoring the significance of this technical indicator in lower time frames.
This indicator acts as a dynamic support or resistance level, often indicating the trend in lower time frames. For LINK, reclaiming this level is crucial to confirm bullish momentum.
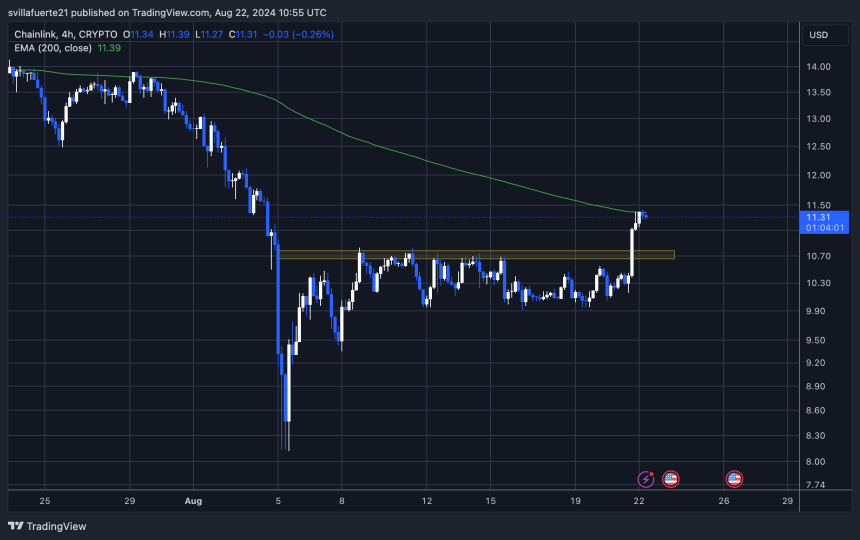
For LINK Bulls to maintain momentum, the next crucial step is to retake the 4H 200 EMA and aim for $13. Conversely, if LINK fails to consolidate above this indicator, it could lead to a retest of the previous resistance at $10.83 and potentially a dip to the higher low around $9.90.
Related Reading
Despite some day traders locking in profits, this activity should be seen as a sign of healthy profit-taking after a modest rally. The current price action reflects a market in consolidation, with traders closely watching for the next move. As LINK hovers near critical levels, the coming days will be pivotal in determining whether the uptrend continues or if a pullback is on the horizon.
Cover image from Dall-E, Charts from Tradingview