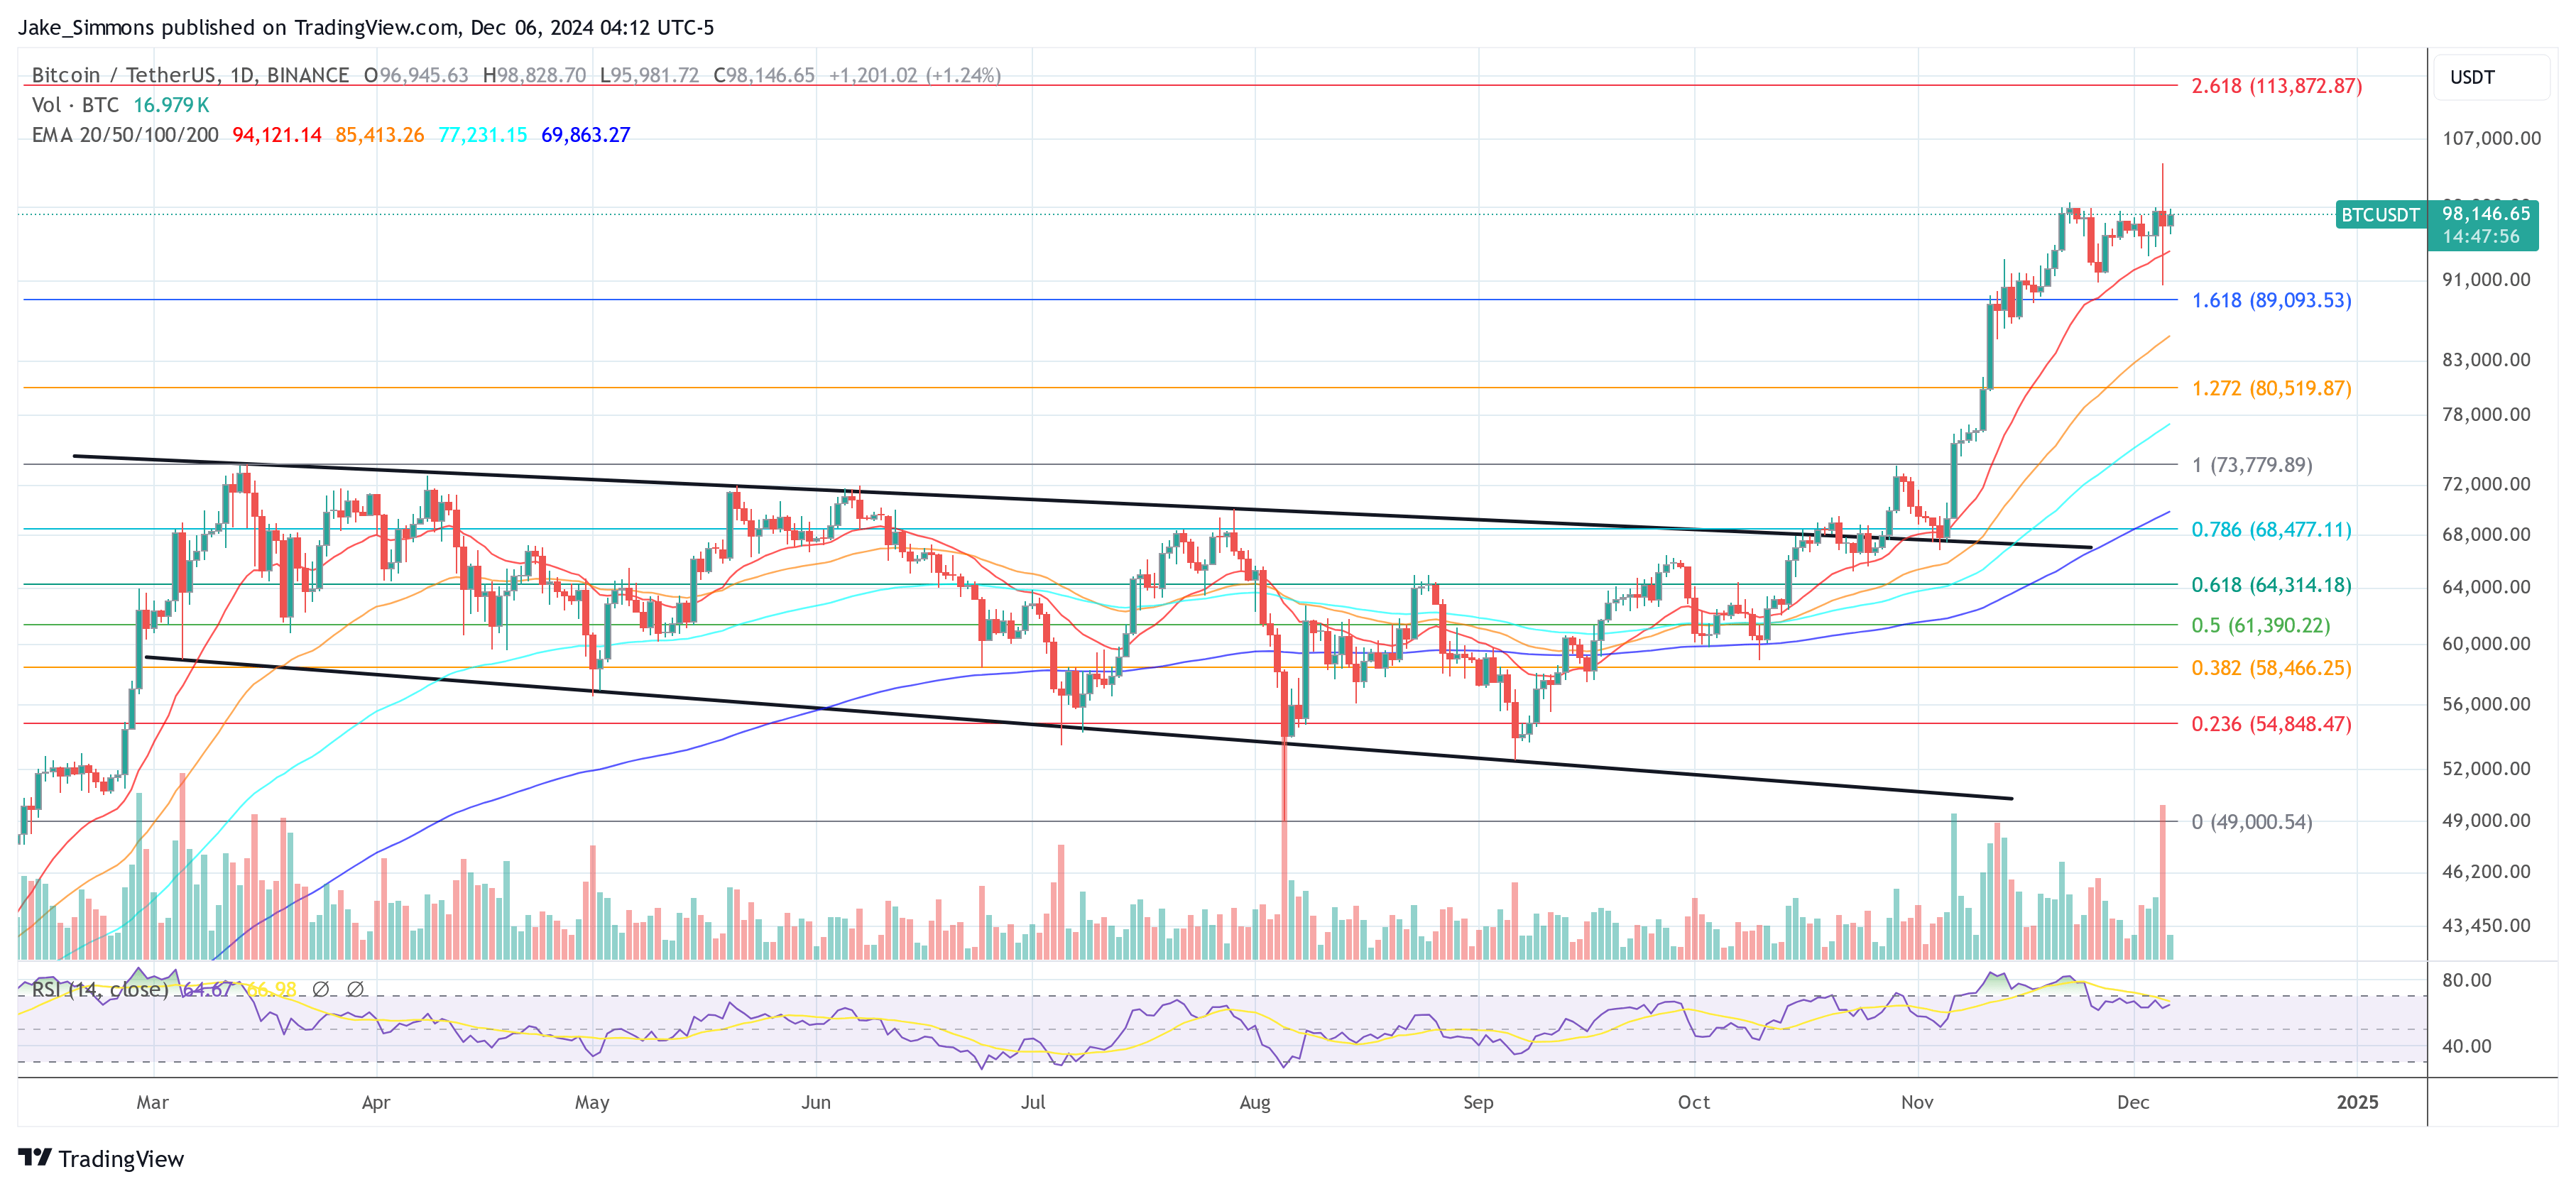
Bitcoin experienced extreme volatility yesterday after reaching a new all-time high of $104,088 on Wednesday. What followed was a textbook “Darth Maul” candle on the daily chart, as BTC plummeted from $103,550 to as low as $90,500 before stabilizing. While some observers initially read the move as a harsh rejection at the psychologically significant $100,000 level, leading analysts suggest this could represent a routine market flush-out rather than a cyclical peak.
Could This Be The Bitcoin Cycle Top?
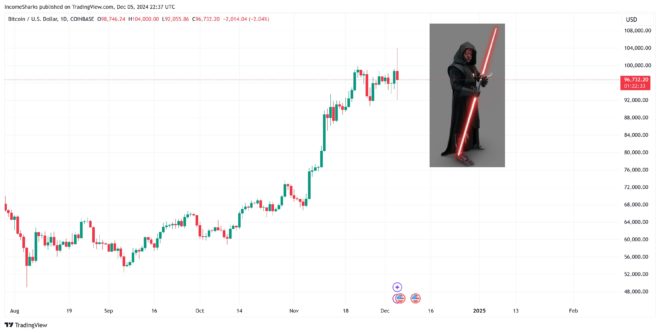
Traders and analysts on X present a unified narrative: the abrupt spike and subsequent plunge were likely orchestrated by large players capitalizing on high-leverage traders. Veteran trader IncomeSharks (@IncomeSharks) stated, “Bitcoin – Classic Darth Maul. Correct me if I’m wrong but I don’t think we’ve seen an asset top with that kind of candle. Usually that’s the punish late longers, trap the shorters, and send it higher candle.”
Another crypto analyst known as Astronomer (@astronomer_zero) added, “It’s just whales using the ‘rinse high leverage button.’ Before continuing whatever it was meant to do. I would want to see the downside of that wick cleared, but that could be it too.”
Related Reading
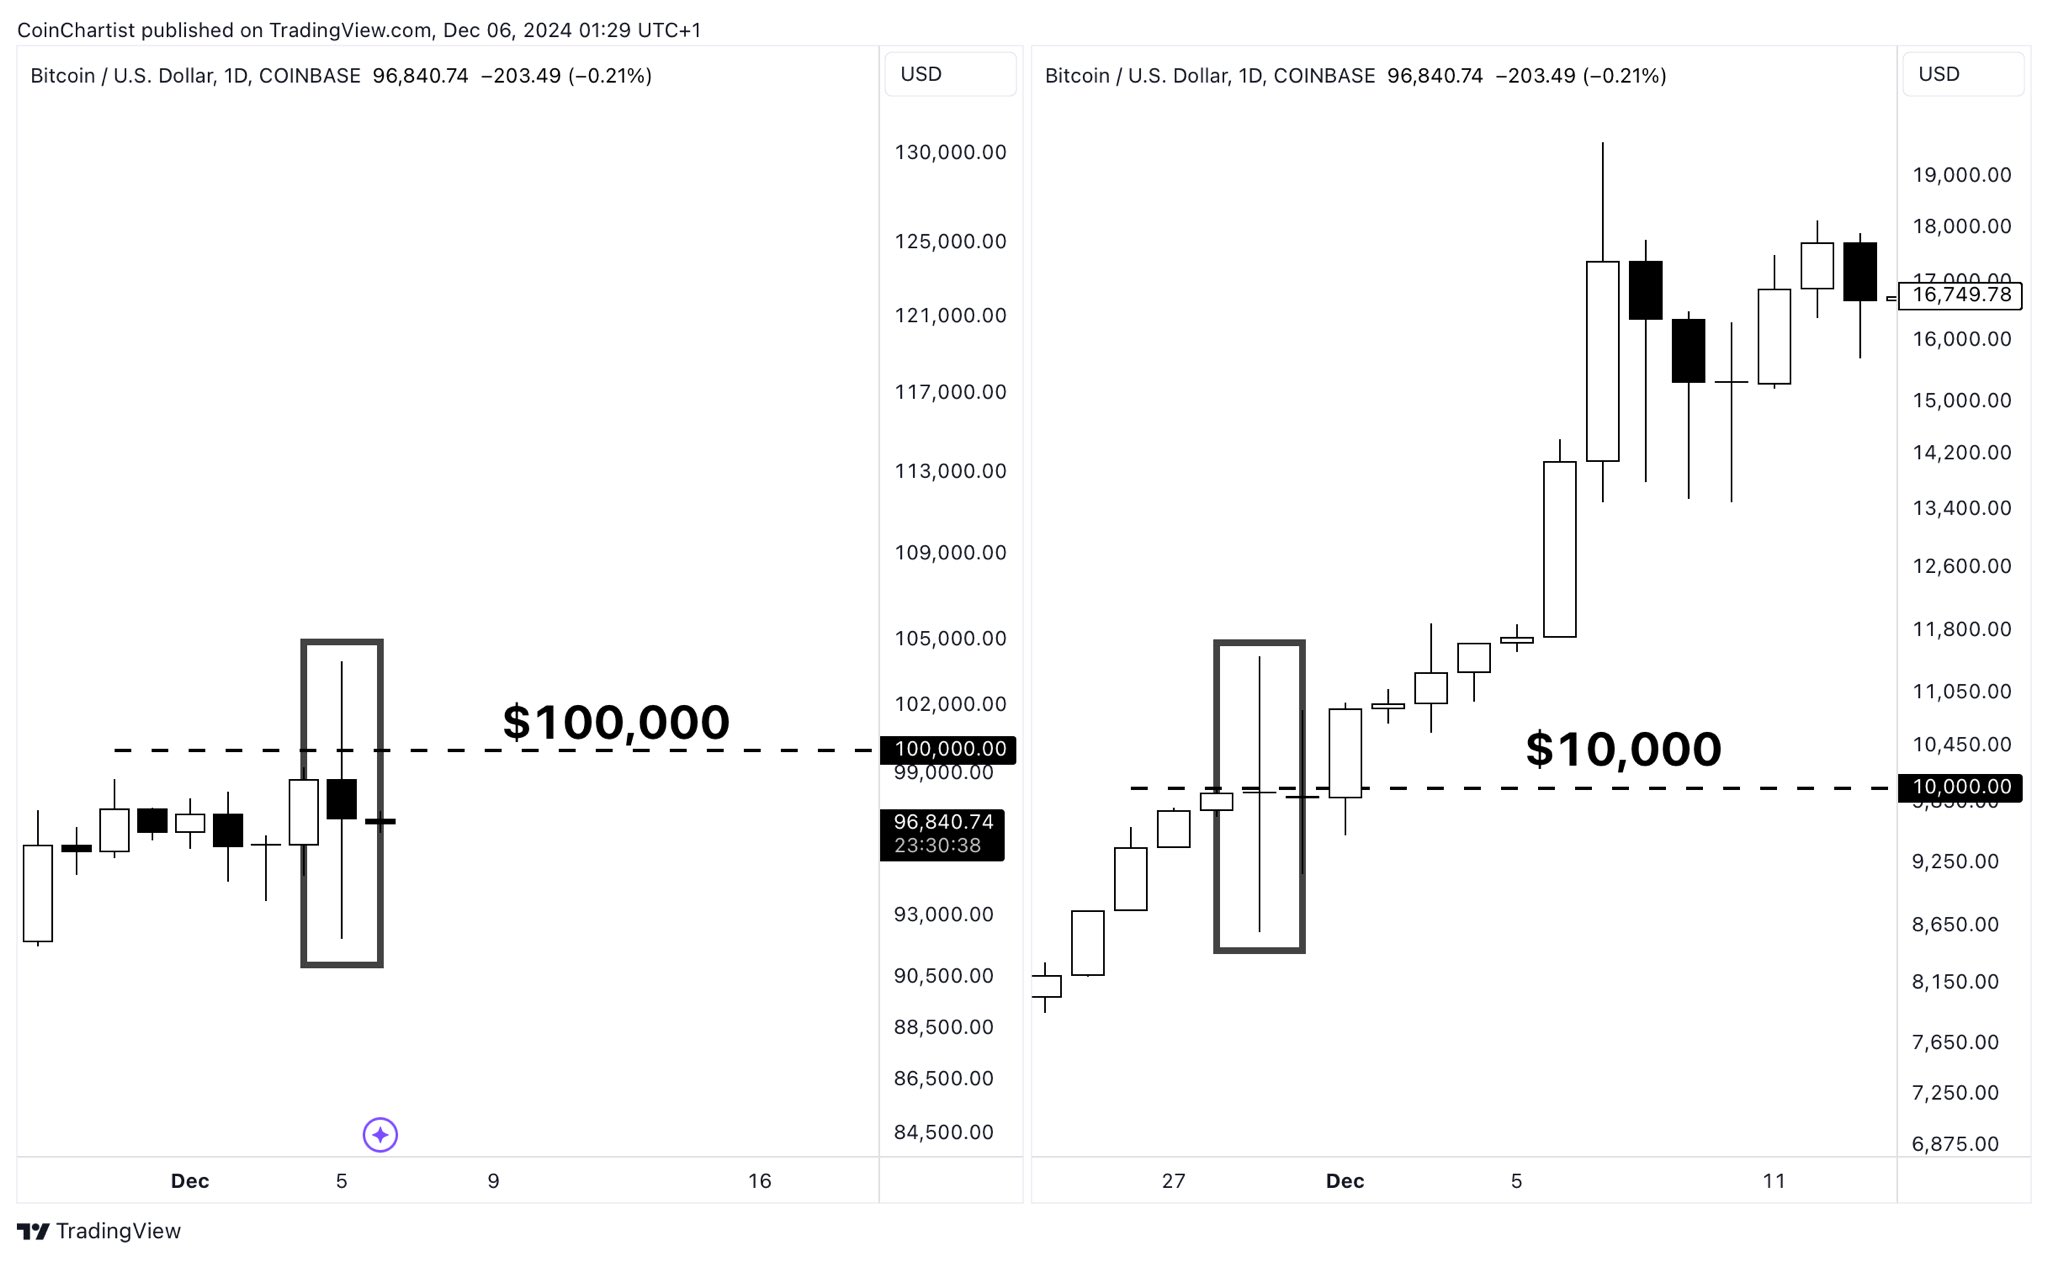
Tony “The Bull” Severino, CMT, underscored the scale of these moves, noting: “An $11K ‘Darth Maul’ on the Bitcoin daily chart. Stops on both sides were run. Incredible intraday volatility in Bitcoin. Welcome to what it’s like for BTC to be $100K. $10,000 moves in a day are now a thing.”
He followed up, “$100K Bitcoin is the new $10K,” sharing comparative charts from the 2020–2021 bull run and drawing parallels to the current price environment.

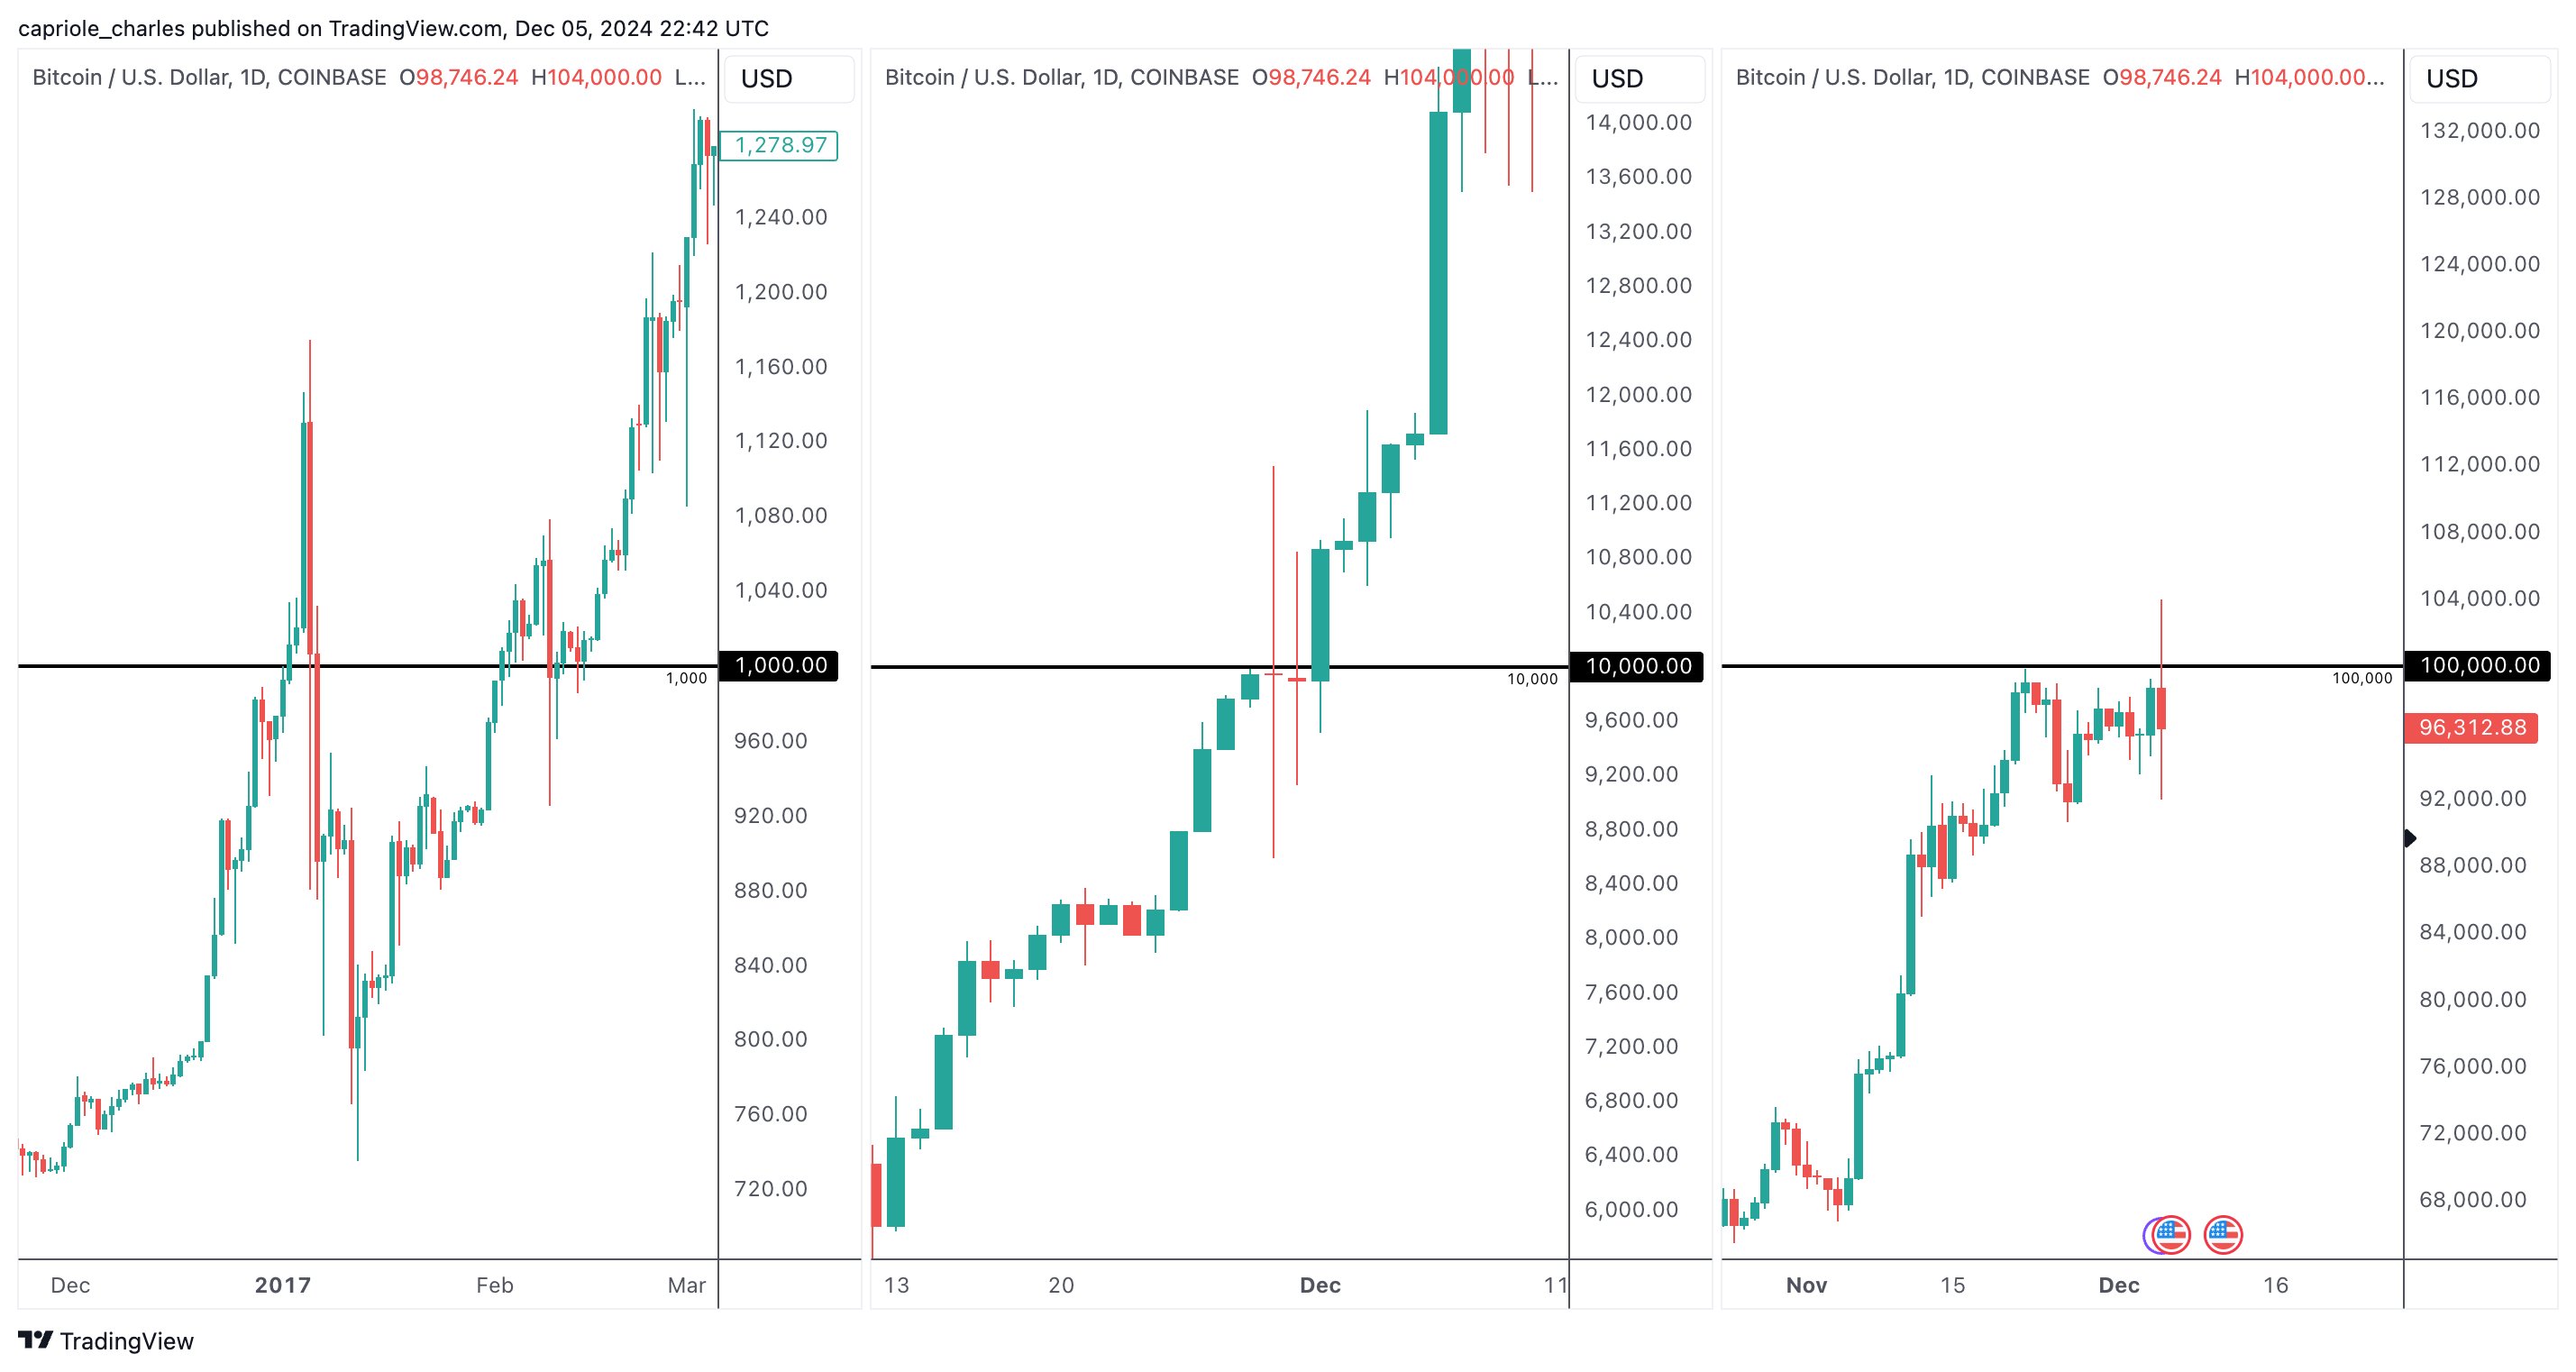
Charles Edwards, founder of Capriole Investments, reinforced this historical context: “Bitcoin. Yes, this is normal.” Edwards posted a similar chart, recalling the volatility when BTC was at $10,000 as well as $1,000 in early 2017.

Key indicators also remain suggestive of further upside. According to Matthew Sigel, head of research at VanEck, top signals are scarce at these levels. “Aside from funding rates, which can stay elevated for some time, very few of our ‘top signals’ indicators say the cycle is peaking. The path of least resistance is still higher, in my opinion.”
Related Reading
Sigel referenced four key metrics: the MVRV Z-Score (still below 5), the Bitcoin Price SMA Multiplier (indicating room for further growth), subdued Google Trends, and Crypto Market Dominance at a mid-range level. These data points collectively imply that the current cycle may not be approaching its apex.
Macro analyst Alex Krüger (@krugermacro) delivered another perspective: “Being asked if that was the top so allow me to share my view. In my book the first levered flush out of a strong bull run, particularly one driven by strong fundamentals, does not mark the top.”
He noted that while the move was widely anticipated in general terms—albeit not precisely timed—it does not alter the underlying strength of Bitcoin’s rally. Krüger added that the sudden retail pivot to older, “dino” altcoins might have signaled a local top for those assets, but not necessarily for Bitcoin: “Nothing really has changed imo. Would have liked to see funding also reset on alts. Alas, we can’t get it all.”
At press time, BTC traded at $98,146.

Featured image created with DALL.E, chart from TradingView.com


