Bitcoin (BTC) sought a rematch with multimonth lows on March 10 as familiar selling accompanied the start of Wall Street trading.
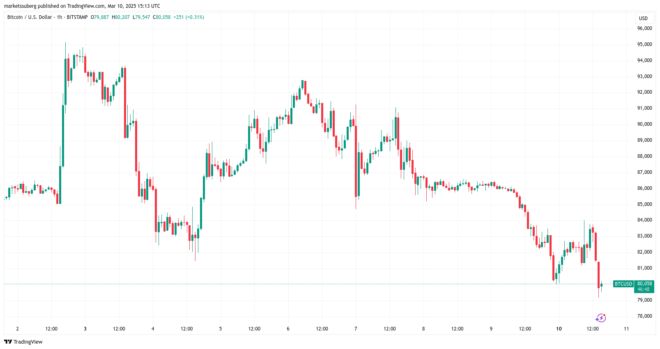
BTC/USD 1-hour chart. Source: Cointelegraph/TradingView
BTC price sags closer to new four-month lows
Data from Cointelegraph Markets Pro and TradingView showed BTC/USD down around 4% on the day to reach $79,170 on Bitstamp.
Weakness into the weekly close continued as risk assets across the board suffered a flight to safety.
Stocks fell substantially at the open, with the S&P 500 and Nasdaq Composite Index down 2% and 3.5%, respectively.
Reacting, trading resource The Kobeissi Letter said that US government spending cutbacks at the hands of the Department of Government Efficiency (DOGE) played a role in the slump.
“While everyone is focused on the trade war, do not discount the impact of reduced government spending expectations,” it wrote in part of its latest analysis on X.
“Government spending and job growth have been ‘fueling’ the economy. DOGE’s cuts will be felt.”

S&P 500 1-day chart. Source: Cointelegraph/TradingView
Kobeissi noted that crypto markets had erased $1 trillion in market cap in just two months.
“The rally after the U.S. Strategic Reserve was announced has been completely erased,” it added on BTC/USD.
Market participants’ views were mixed as it became unclear where BTC price action might put in a more reliable floor.
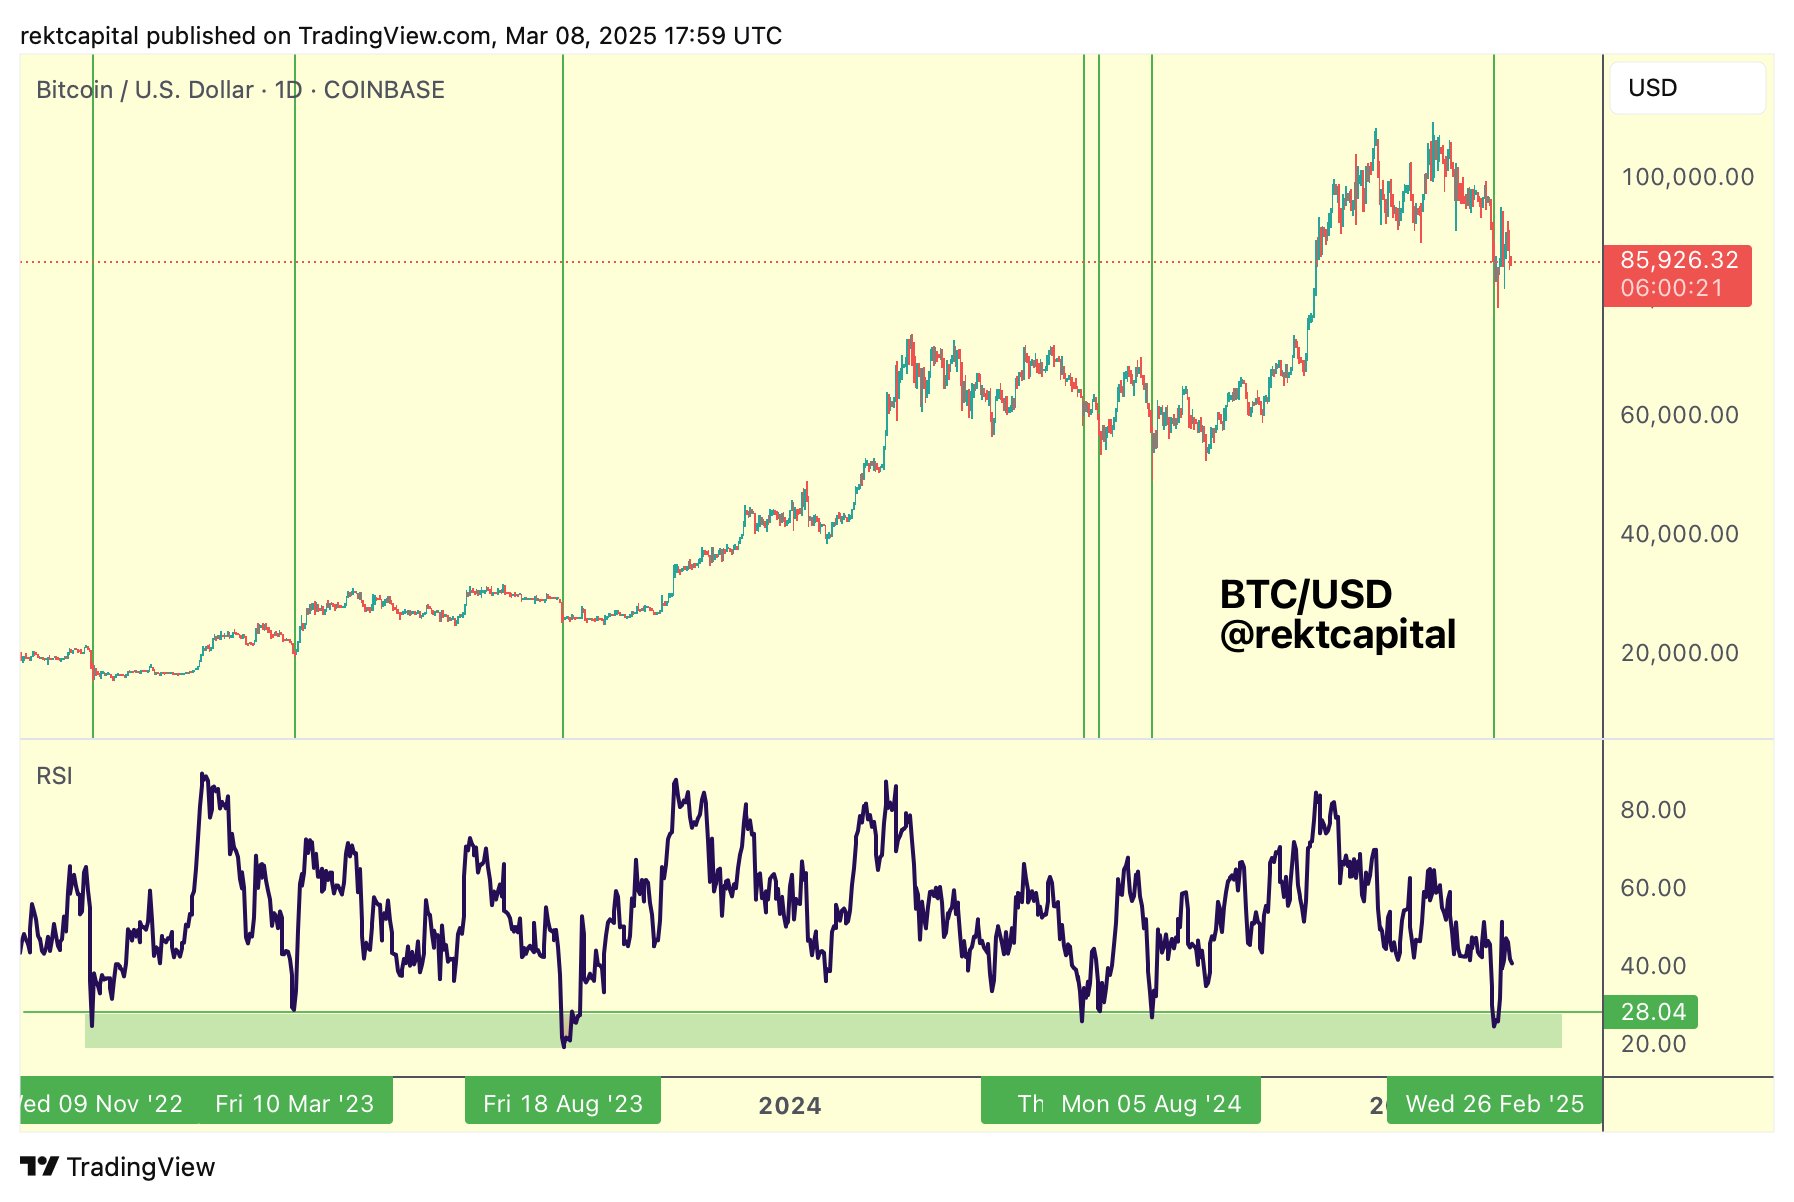
Popular trader and analyst Rekt Capital advised X followers to look for rising relative strength index (RSI) values against lower prices for reversal cues.
“Going forward, it’ll be worth watching for Bitcoin to form Lower Lows on the price action and Higher Lows on the RSI for a Bullish Divergence to develop,” he wrote about daily timeframes.
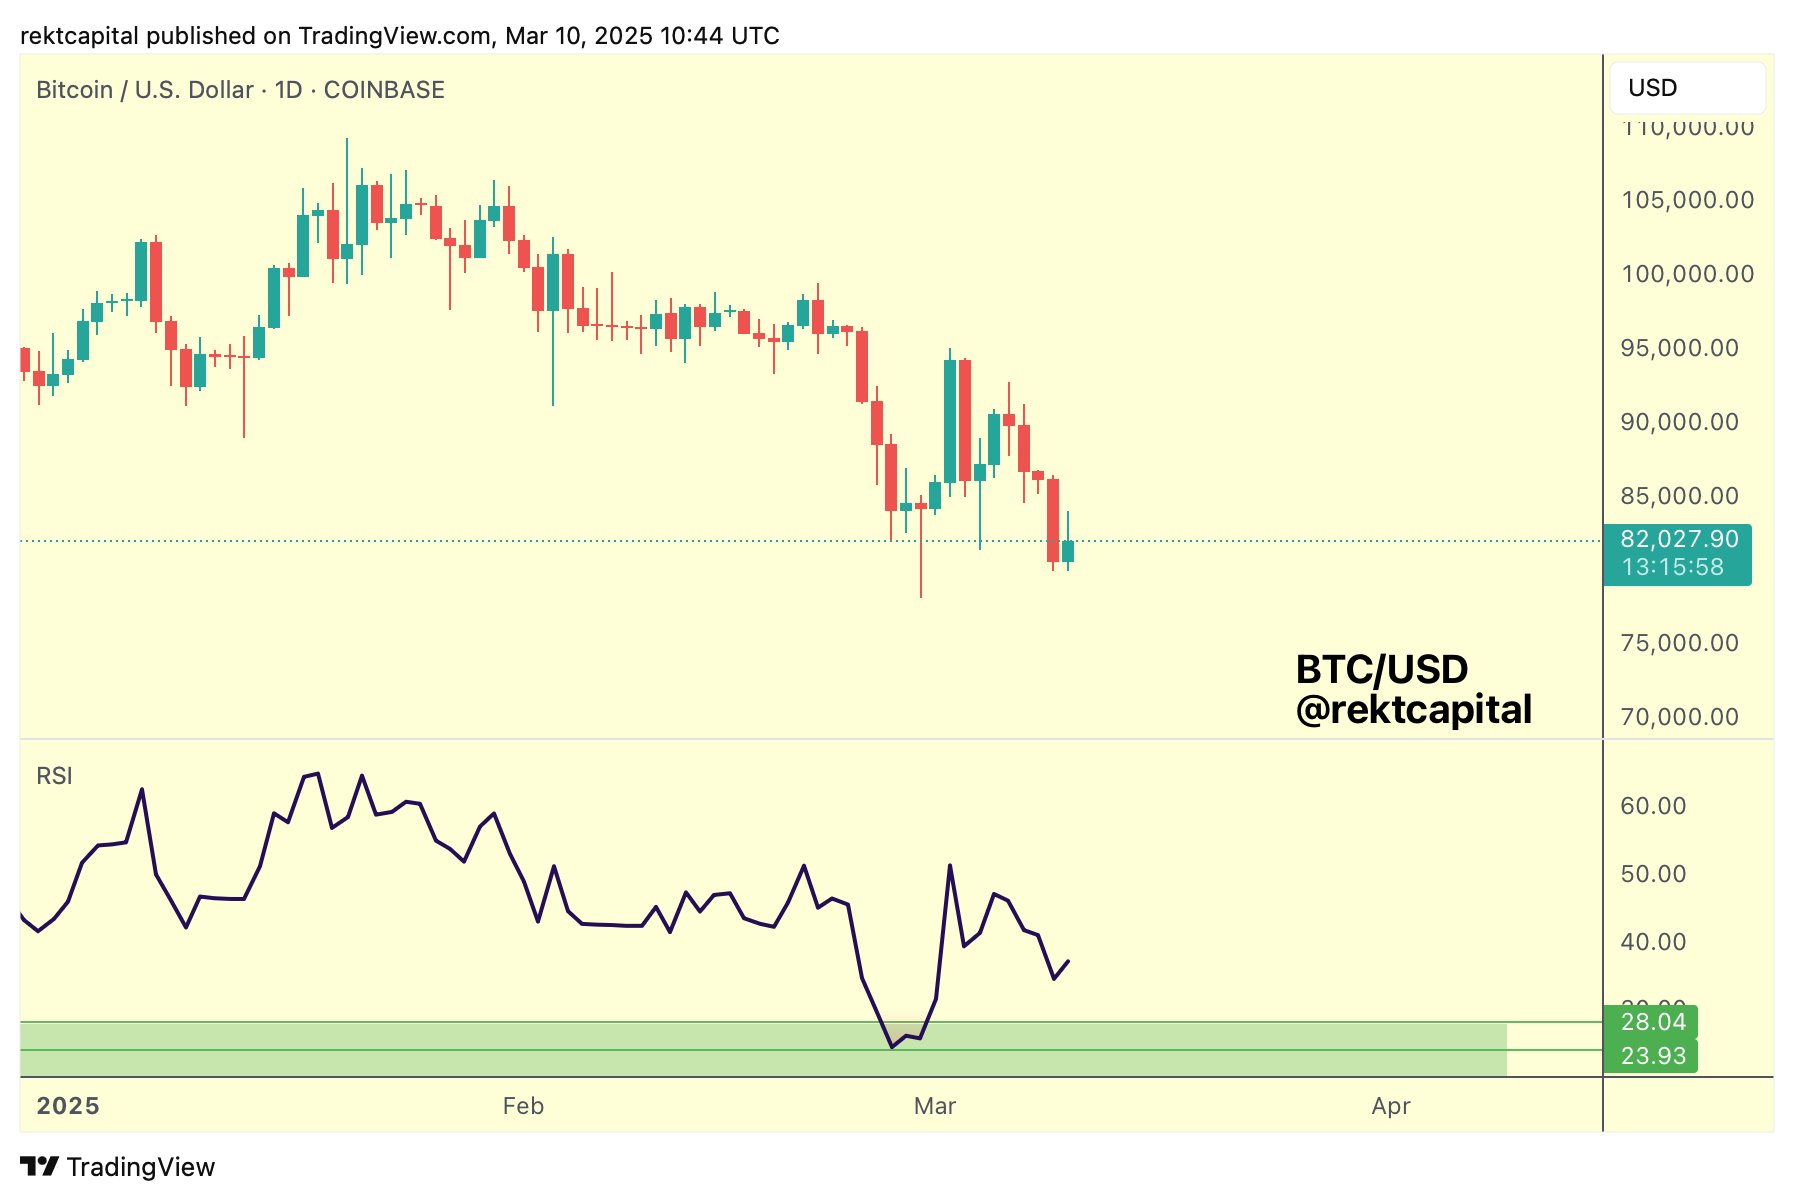
BTC/USD 1-day chart with RSI data. Source: Rekt Capital/X
A further post noted that the current bull cycle had produced bounces whenever the daily RSI was below 28.
Specifically, “Bitcoin’s price would either bottom or be between -2% to -8% away from a bottom,” he explained.
Daily RSI stood at 33.2 at the time of writing.
BTC/USD 1-day chart with RSI data. Source: Rekt Capital/X
Bybit hack remains the elephant in the room
Elsewhere, trading firm QCP Capital pinned the blame for the broader crypto market downside on sell-offs tied to last month’s hack of crypto exchange Bybit.
Related: Biggest red weekly candle ever: 5 things to know in Bitcoin this week
“Today’s price selloff may also be exacerbated by holders preemptively front-running further hacker-driven supply, now that the hackers have shown willingness to cash out rather than risk further losses — having already seen their stolen assets depreciate by 25%,” it wrote in its latest bulletin to Telegram channel subscribers.
“In response, risk reversals have become even more bid for Puts over the past 24 hours, reflecting growing concerns over additional selling pressure.”
QCP data showed market expectations becoming more optimistic only from Q3 onward.
“Until crypto finds a new narrative, we’re likely to see an increased correlation between BTC and equities in the near term,” it concluded, referencing upcoming US macroeconomic data releases.
“Both risk assets are currently trading near their recent lows, and with tariff risks still looming, volatility could pick up heading into key U.S. macro data releases — CPI (Wed) and PPI (Thu).”
This article does not contain investment advice or recommendations. Every investment and trading move involves risk, and readers should conduct their own research when making a decision.