
Bitcoin (BTC) price has rebounded by over 11% from the April. 7 low of $74,400, and analysts believe that onchain and technical indicators point to a sustained recovery.
According to popular analyst AlphaBTC, Bitcoin will see a sustained recovery if it holds above $81,500.
Bitcoin price reclaimed the $80,000 psychological level after retesting the “weekly open and filling in some of the inefficiency left by the Trump 90-day pause pump,” the analyst said in an April 10 post.
“I really want to see it back above 81.5k soon, and we may see a bit more sustained upside as shorts get squeezed.”
BTC/USD four-hour chart. Source: AlphaBTC
Similar sentiments were shared by fellow analyst Rekt Capital, who said that Bitcoin needs to produce a weekly close above $80,500 to increase the chances of recovery.
“Bitcoin has recently lost the red Weekly level, just confirming BTC isn’t out of the woods yet,” Rekt Capital said in an April Post on X.
“$BTC needs to stay above red until the Weekly Close for the price to reclaim this Weekly level as support.”
BTC/USD weekly chart. Source: Rekt Capital
Bitcoin price recovery could be fueled by “seller exhaustion”
Bitcoin investors are approaching a degree of “near-term seller exhaustion,” as evidenced by the reduced magnitude of realized losses, according to onchain data from Glassnode.
Looking at the 6-hour rolling window for realized losses, the market intelligence firm found that the magnitude of losses realized during these drawdowns has started to decrease with each successive price leg lower.
“Bear markets are typically initiated by periods of heightened fear and substantial losses,” Glassnode said in its latest Week On-chain report.
“This suggests a form of near-term seller-exhaustion may be starting to develop within this price range.”
Bitcoin: 6-hour rolling losses. Source: Glassnode
Related: Is Bitcoin price going to crash again?
Bollinger Bands and W bottom hint at new price highs
After hitting a five-month low of $74,400 on April 9, Bitcoin retested the lower boundary of the Bollinger Bands (BB) indicator, a line that has supported the price over the last five weeks, data from Cointelegraph Markets Pro and TradingView shows.
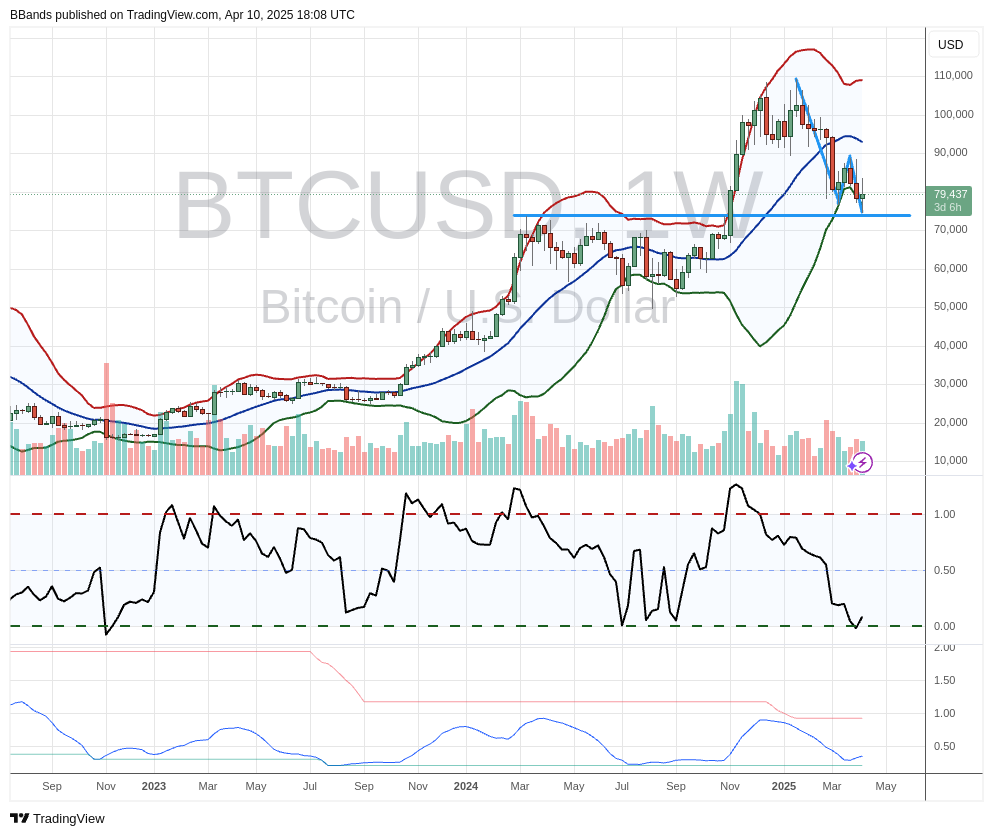
BTC/USD weekly chart with Bollinger Bands. Source: John Bollinger/TradingView
This is an encouraging sign from Bitcoin, according to the creator of the Bollinger Bands volatility indicator, John Bollinger. The Bollinger Bands indicator uses standard deviation around a simple moving average to determine both likely price ranges and volatility.
Bollinger said that Bitcoin price could be forming the second low of a W-shaped pattern formation — a double-pronged bottom followed by an exit to the upside — on the weekly chart.
“Classic Bollinger Band W bottom setting up in $BTCUSD,” Bollinger commented alongside a chart, adding that the pattern “still needs confirmation.”
In this situation, Bitcoin’s drop to $76,600 on March 11 was the first bottom, and the recent drop to $74,400 was the second.
If confirmed, BTC price could recover from the current levels first toward the neckline of the W-shaped pattern at $88,800 before rising toward the target of the prevailing chart pattern at $106,000.
This article does not contain investment advice or recommendations. Every investment and trading move involves risk, and readers should conduct their own research when making a decision.