XRP (XRP) has dropped nearly 40% since hitting its multi-year high of $3.40 three months ago.
Still, its ability to hold above key technical support levels, combined with a potentially market-shifting derivatives listing, has prompted some analysts to maintain a bullish outlook for the months ahead.
Coinbase XRP futures may launch on April 21
From a fundamental perspective, XRP may receive a boost from the anticipated launch of XRP futures contracts on the Coinbase Derivatives platform, scheduled for April 21 under the US Commodity Futures Trading Commission’s (CFTC) oversight.
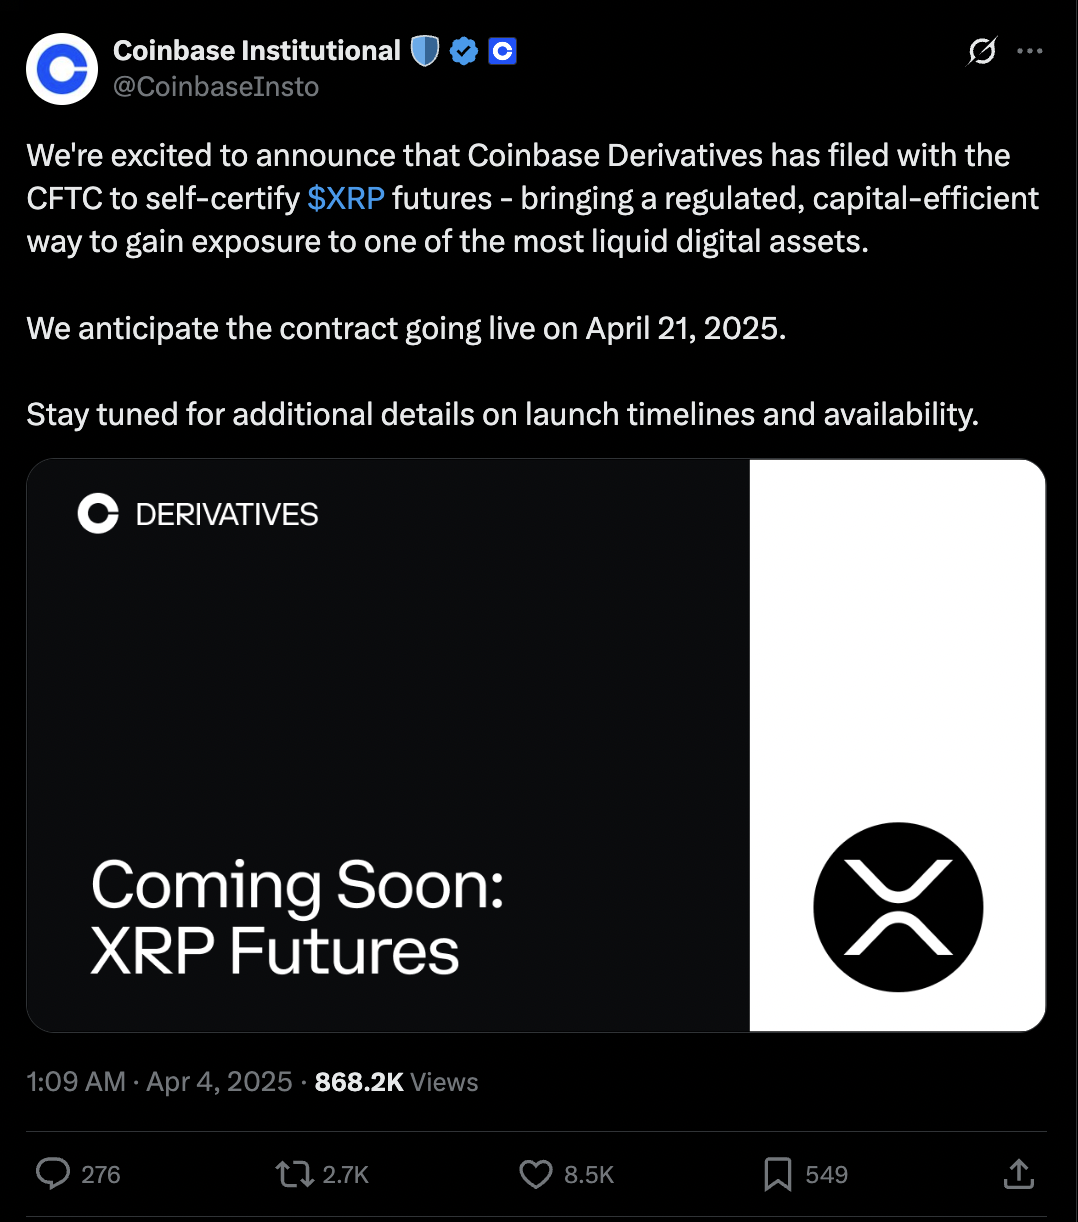
This development may inject fresh liquidity and institutional interest into the market, helping catalyze the technical breakouts projected above.
XRP price chart painting Wyckoff reaccumulation
XRP’s ongoing consolidation phase resembles a classic Wyckoff reaccumulation pattern, according to technical analyst Charting Guy.
The Wyckoff reaccumulation pattern is a mid-cycle structure that often precedes the next leg of a broader uptrend. It suggests that smart money is absorbing supply during the cooldown, setting the stage for a potential breakout.
XRP established support and began consolidating in late 2024, marking Phases A and B of the Wyckoff reaccumulation pattern. In early April 2025, the price formed a “Spring” followed by a successful “Test,” signaling seller exhaustion.
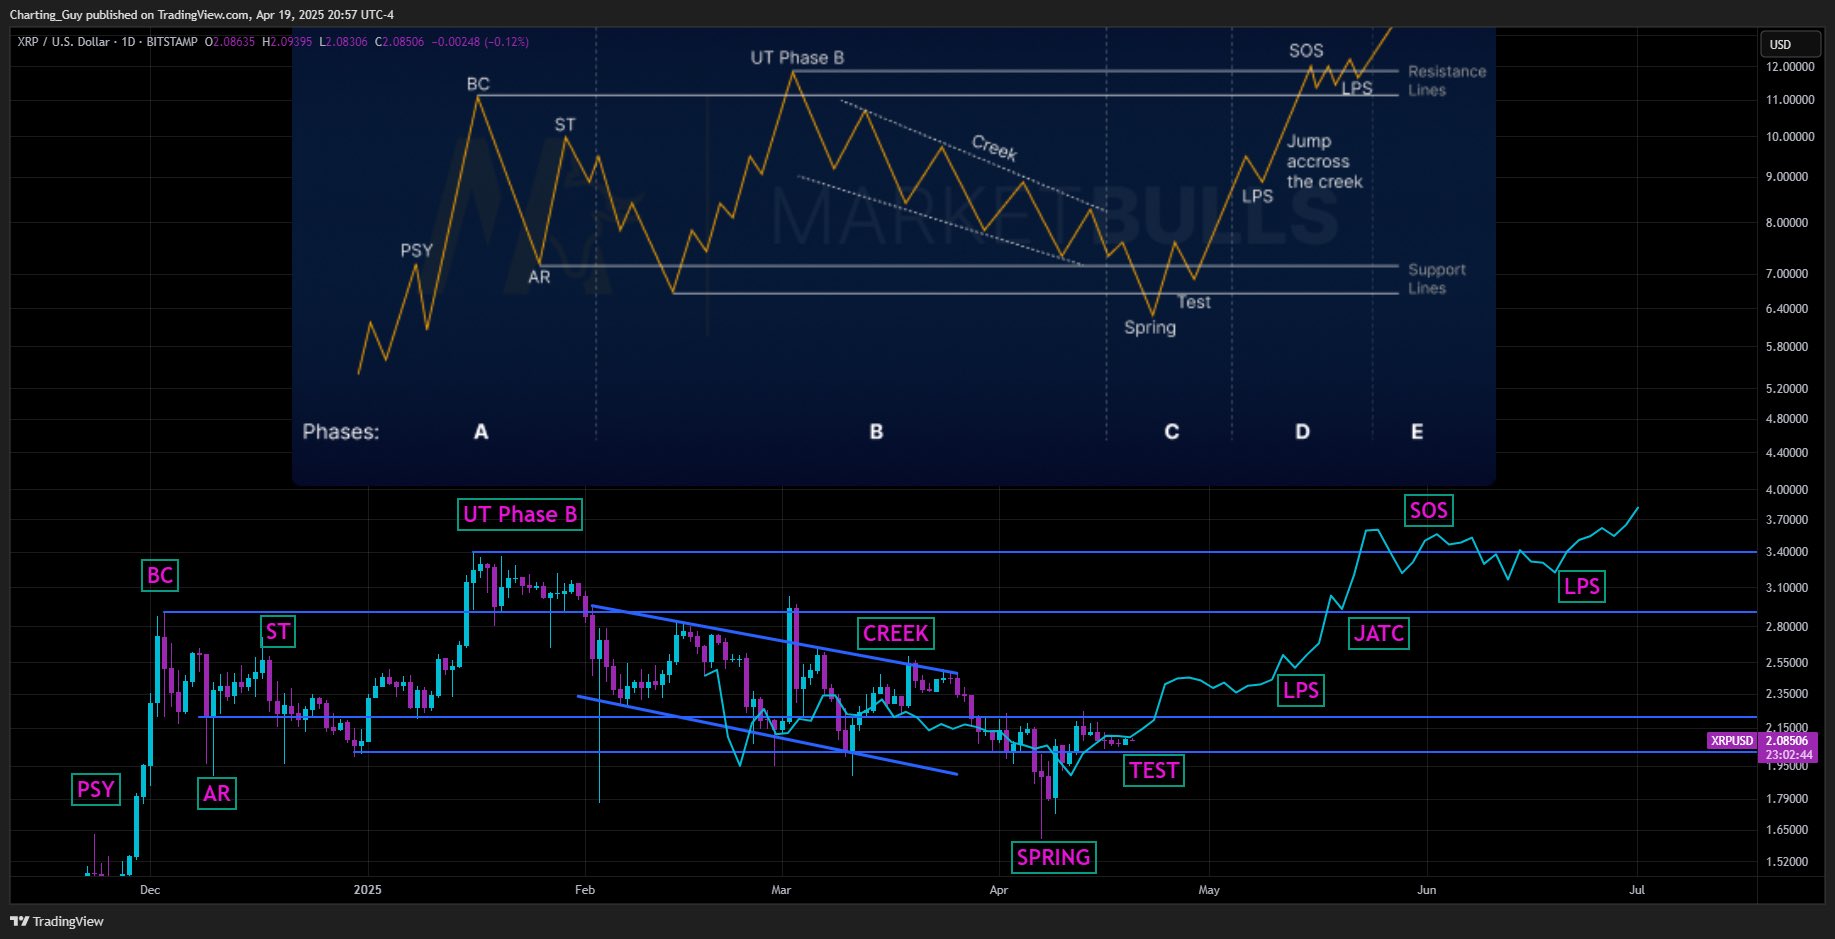
As of April 21, XRP is attempting to break above the descending “Creek” trendline.
A breakout would confirm a “Jump Across The Creek” (JATC) and entry into Phase D. If confirmed, XRP could enter Phase E and rally 70% toward $3.55 in the coming weeks, a level aligning with the pattern’s Last Point of Support (LPS).
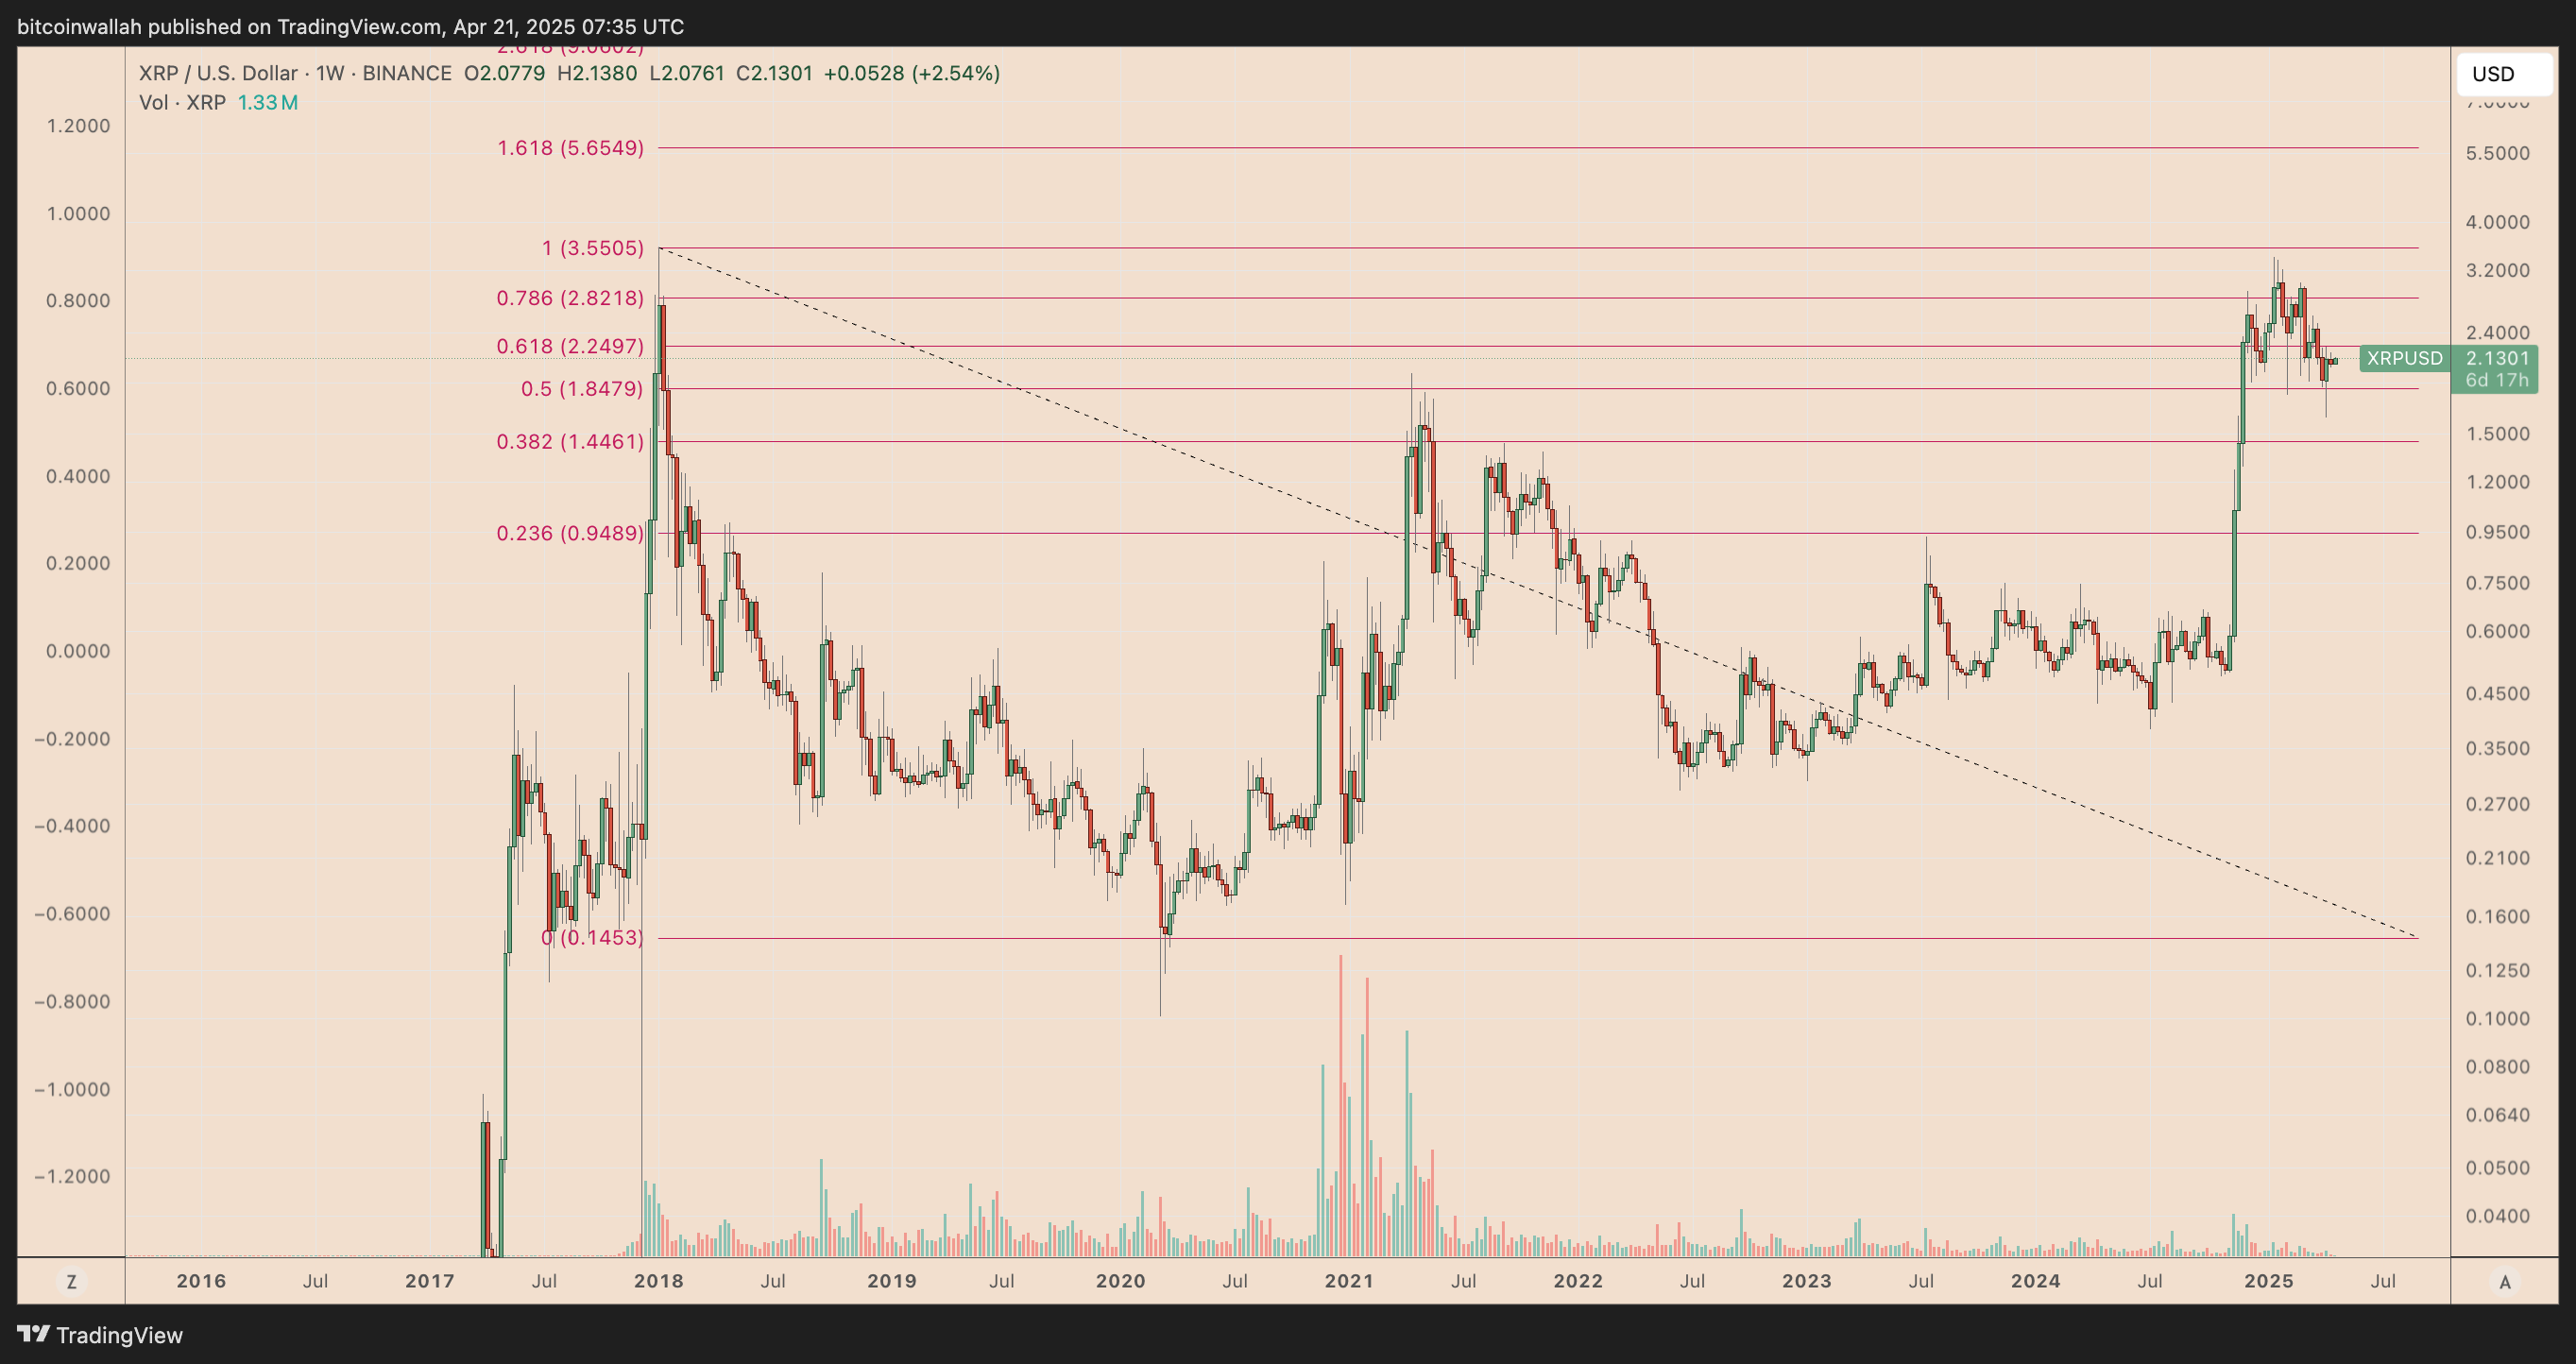
A Fibonacci retracement graph drawn from $3.55-swing-high to $0.14-swing-low presents $5.65 as the upside target for June if XRP price breaks above $3.55.
Falling wedge aligns with XRP’s bullish outlook
The upside outlook aligns with XRP’s prevailing falling wedge pattern, as spotted by chartist “Jobcfx” on X.
Notably, the bullish reversal structure has been narrowing since February 2025. A breakout above the wedge’s upper trendline, currently around the $2.20-2.40 area, would signal the start of a new rally.
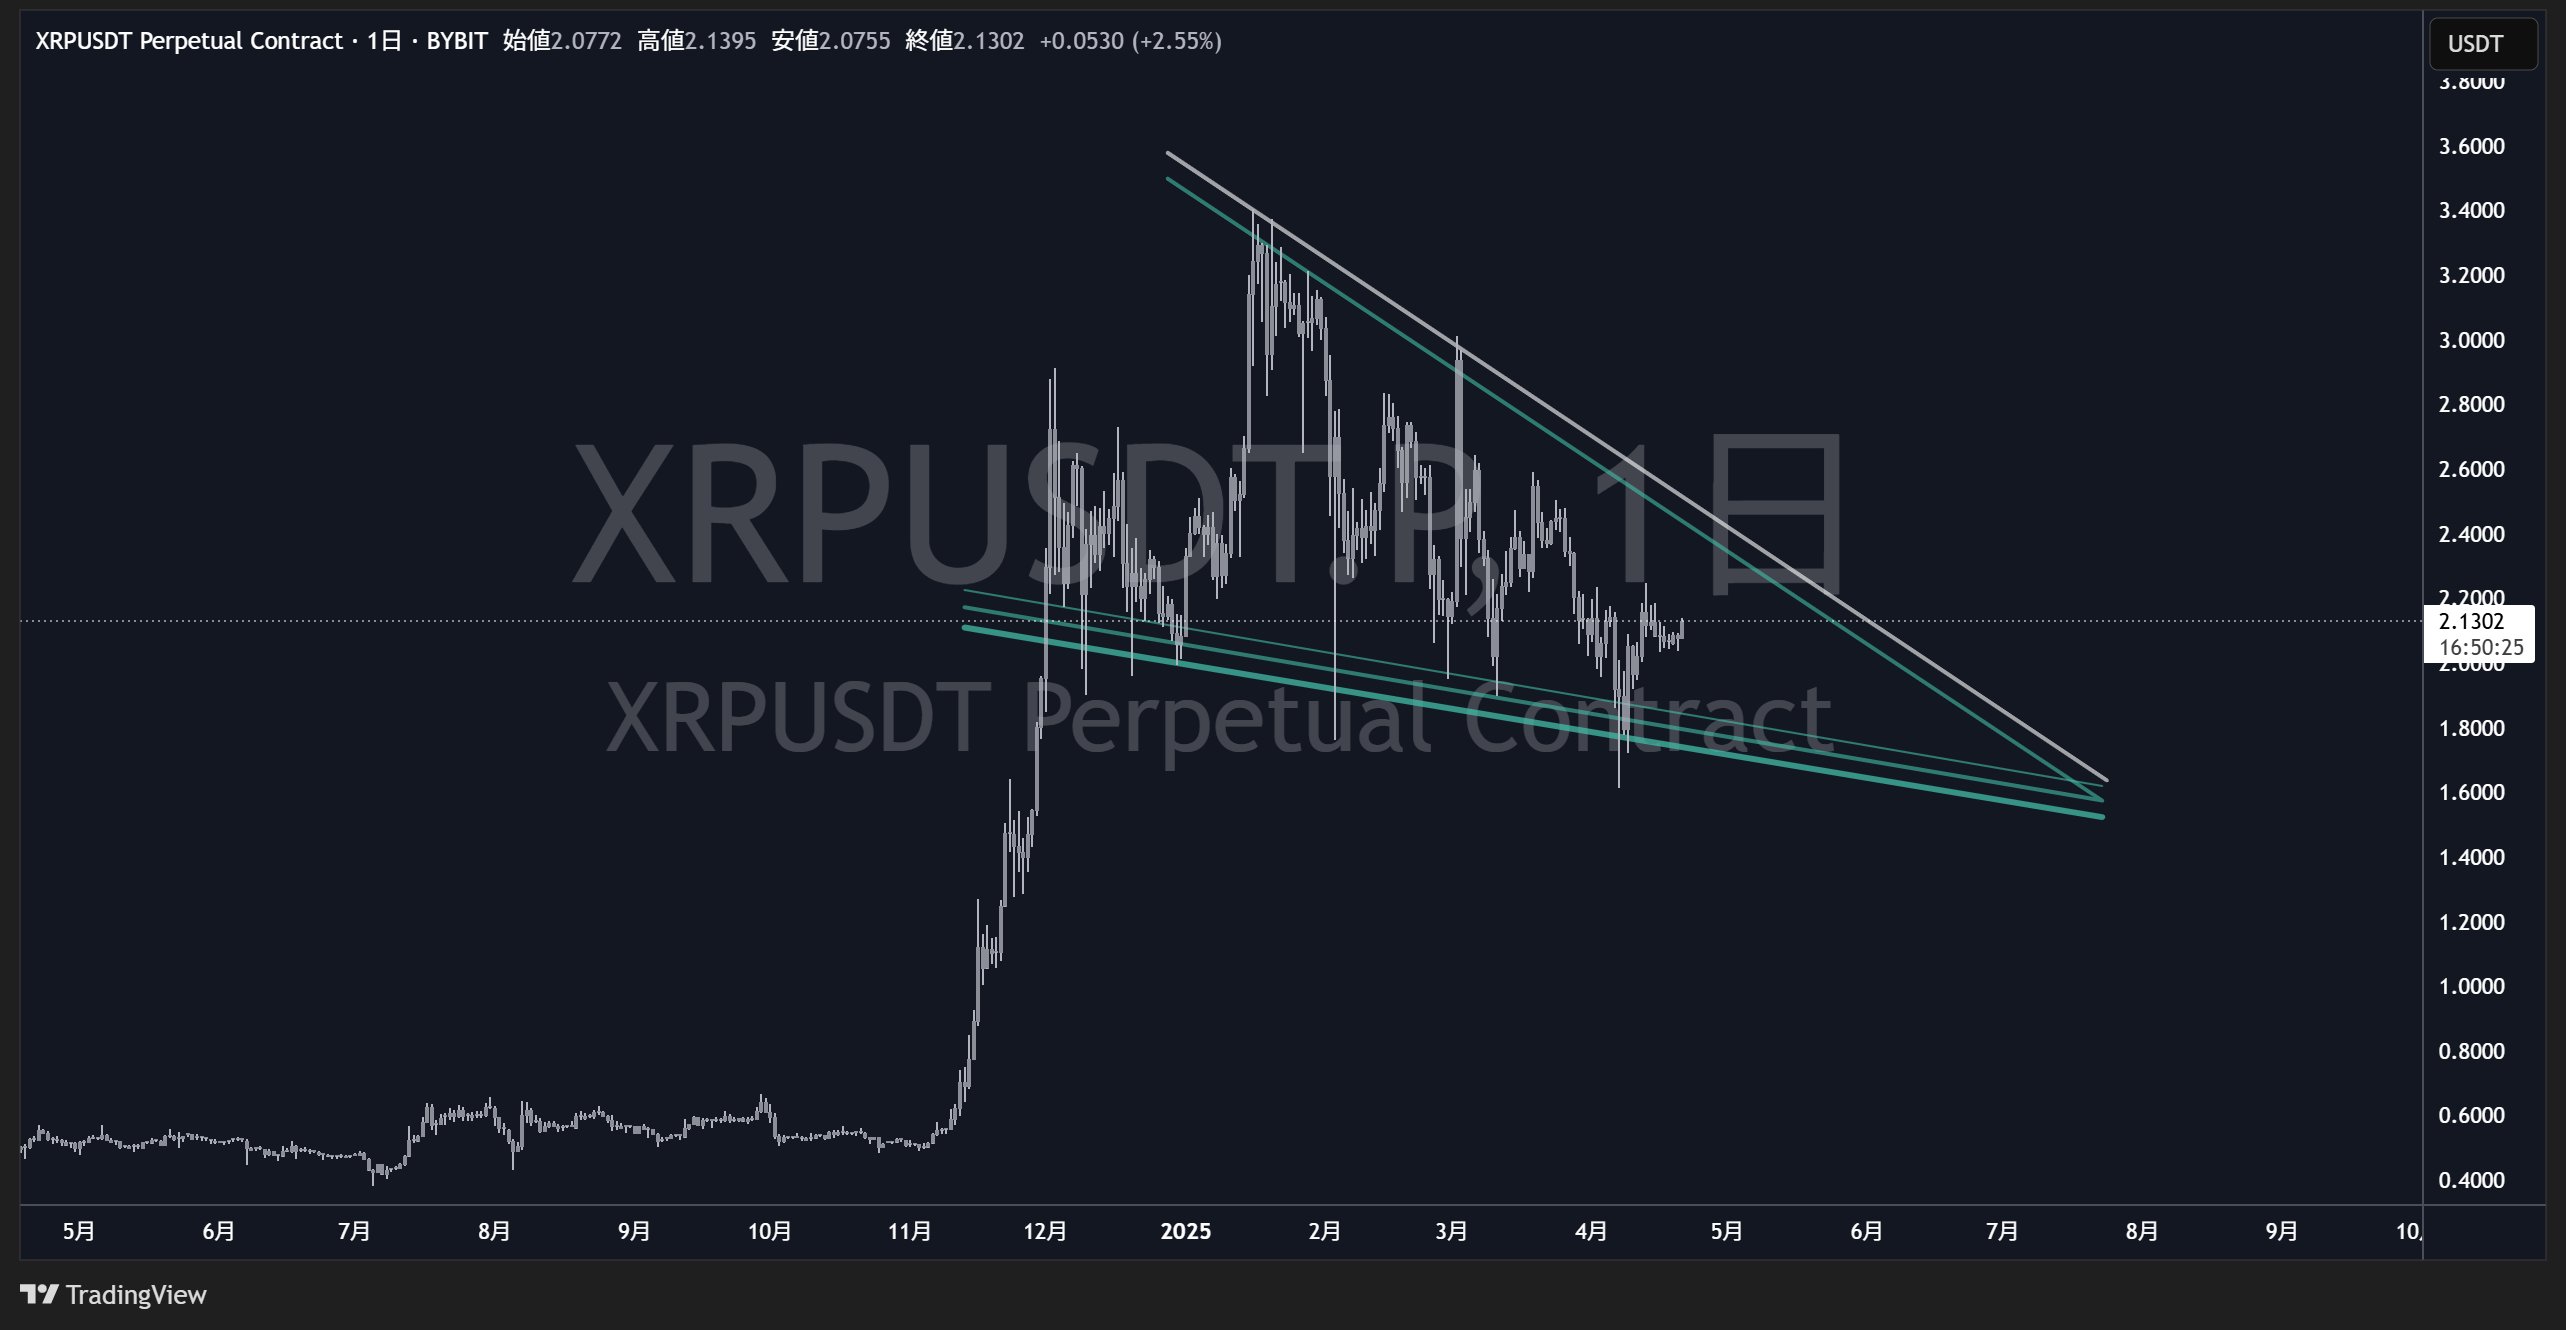
Falling wedge breakouts typically target a move equal to the pattern’s maximum height.
In XRP’s case, if it breaks above $2.20, the projected upside target for May lands near $4.00, aligning with the Wyckoff reaccumulation’s Phase E breakout zone.
Related: XRP price analysts project $10 next, ‘optimistic’ target of $20
Interestingly, Bitcoin (BTC) is also forming a falling wedge pattern on its chart. If confirmed, a bullish breakout in Bitcoin could act as a catalyst for the altcoin market, potentially accelerating XRP’s upward momentum as well.
This article does not contain investment advice or recommendations. Every investment and trading move involves risk, and readers should conduct their own research when making a decision.


