Reason to trust
Strict editorial policy that focuses on accuracy, relevance, and impartiality
Created by industry experts and meticulously reviewed
The highest standards in reporting and publishing
Strict editorial policy that focuses on accuracy, relevance, and impartiality
Morbi pretium leo et nisl aliquam mollis. Quisque arcu lorem, ultricies quis pellentesque nec, ullamcorper eu odio.
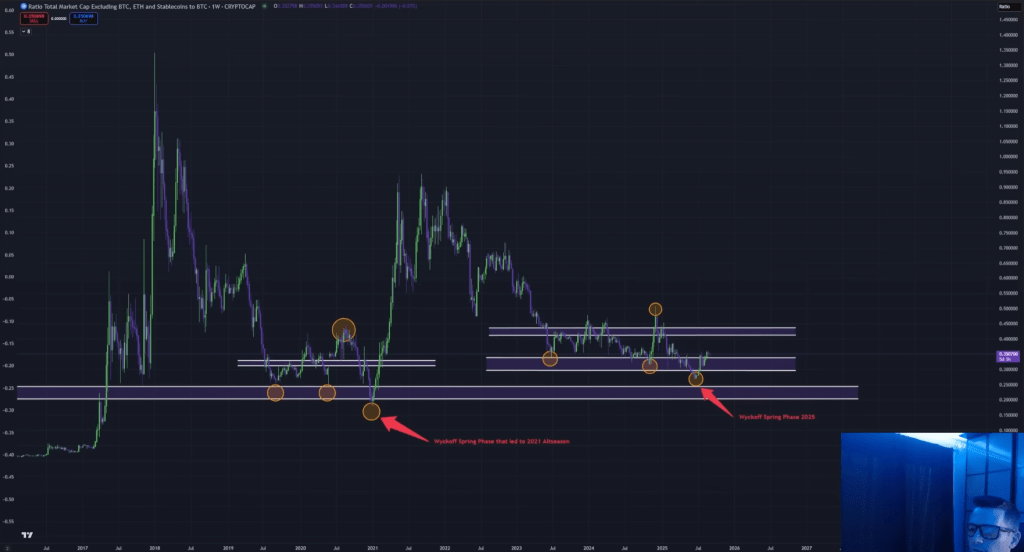
Crypto analyst Kevin (Kev Capital TA) argues that altcoins are replaying the same structural script that preceded the 2021 “altseason,” this time on the ratio of the altcoin market cap excluding Ethereum and stablecoins versus Bitcoin (often proxied as “Total3/BTC”). In a video posted late on September 2, he contends that confluence across weekly and monthly timeframes—on both linear and logarithmic scales—shows a Wyckoff-style bottoming process culminating in a “spring” and range reclaim, with momentum and breadth indicators lining up the way they did ahead of the 2021 surge.
Altcoins Gear Up For Major Run
Kevin frames the current moment as a direct analogue to the last cycle’s transition from despair to acceleration, emphasizing that the structure, not headlines, came first then as now. “We are seeing weekly time frame, monthly time frame historical setups,” he said, adding that the weekly linear chart of Total3/BTC has retraced into an accumulation range, pierced support in a capitulation-style flush, and then reclaimed the range—what he calls a “spring phase” that “led to the 2021 alt season.” The sequence, he argues, is strikingly similar to the 2018–2020 base that ultimately exploded higher in 2021 after the market “gave up” on altcoins.
The analyst is explicit that this setup is conditional on macro “ingredients” that enable risk to be repriced. “We are going to need to see lower inflation or flat inflation, a softening labor market but not a crashing labor market, and softening growth but not crashing growth,” he said. That mix, in his view, would allow the Federal Reserve to shift the balance of risk toward employment, pull down the two-year yield, lift rate-cut expectations, and perhaps curtail the “last little bit” of quantitative tightening—“maybe even have a neutral to expanding balance sheet.” With “a lot of macro data coming over the next three weeks” and the FOMC set for September 17, he argues Q4 is the critical window. “It’s all lining up right now… we just need that last push.”
Related Reading
On the weekly linear timeframe, Kevin points to indicator symmetry with the 2021 liftoff. He cites a fresh weekly buy on Market Cipher and says its “money flow” profile is tracing the same contour as the prior cycle’s spring. He adds that “whale money flow bottomed out at the exact same level as it did in 2021,” the MACD “crossed to the upside at the exact same level,” and the stochastic RSI has already surged to 96. In 2021, he notes, “once we broke the 80 level and stayed above it… you got your most aggressive price action.” The implication is that a push toward the “100 level” could coincide with the period of maximum upside impulse, as it did during the last cycle’s early thrust.
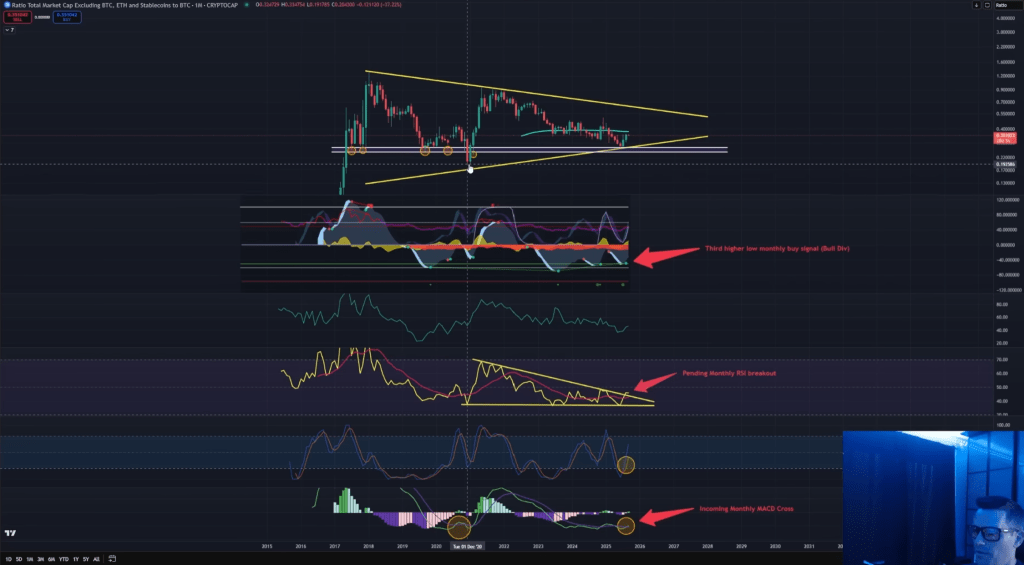
He then zooms out to the monthly log chart of Total3/BTC, where he locates what he describes as an eight-year support band around “the 0.27 to 0.24 area,” a long down-trendline of resistance now meeting “a higher low structure,” and a momentum backdrop he characterizes as classically divergent.
On Market Cipher’s monthly momentum waves, “higher lows, higher lows, higher lows, while price action made lower lows… that is a bullish divergence,” he said, stressing that this signal is most potent at major historical supports. The monthly RSI, he adds, appears to be “peeking our heads out” of a multi-year downtrend channel for the first time since the 2021 top. Meanwhile, the monthly stochastic RSI has carved a “full-blown V-shaped turn” up from near zero but has “hasn’t even come close to breaking the 80 level yet,” which in his framework is precisely when “you will not see your most bullish price action until you break the 80 level.”
Related Reading
Kevin places particular weight on a double-bottom motif in his monthly L-MACD read, calling it “the same exact bottoming pattern” that formed between June and December 2020. “When you double bottom and make a basically a double bottom… game on,” he said, arguing that the renewed cross echoes the momentum inflection that preceded the altcoin surge into early 2021. He also notes that July and June printed a two-step low similar to the June/December 2020 pair that marked the prior regime shift.
Crypto’s Biggest Run Ever?
The through-line is that breadth is beginning to turn at a structural level while momentum gauges transition from deeply negative to positive across timeframes. He underscores that the signal is appearing in tandem across linear weekly and log monthly views, which he describes as unprecedented in its alignment. “There’s never been a time where these two charts have looked the way that they look in tandem on log and linear on the weekly, on the monthly,” he said. If that symmetry holds, he expects “the altcoin market cap to start stealing dominance away from Bitcoin at a higher faster pace than we’ve seen since the previous altcoin season.”
Although his thesis centers on Total3/BTC, Kevin frames it within his earlier, well-telegraphed Ethereum calls from May/June, arguing that “ETH… has hit a new all-time high” and that “the bottom is in on ETH versus Bitcoin, ETH dominance, and obviously the ETHUSD chart.” He presents the altcoin rotation as a sequel: “Very similar to how ETH versus Bitcoin and ETH dominance and even ETHUSD were setting up before it made its big run against Bitcoin,” with Total3 now showing “two months in a row of outperformance” from a major support band—a combination he had highlighted in Ethereum before its advance.
Even with the technicals aligned, Kevin is careful to caveat timelines and seasonality. He characterizes September as “usually weak,” with the more forceful phase of any rotation likely contingent on macro confirmation into Q4. “The charts can precede the news,” he said, “however, that’s never guaranteed.” For now, he sees a maturing base, a reclaimed range after a capitulative spring, and momentum structures that, in prior cycles, marked the boundary between grinding bottoms and impulsive advances. “If there was ever going to be a time that it was going to happen… now’s the time,” he concluded, while reiterating the dependency on incoming data: “I don’t know what the macro data is going to look like, but I know what this chart looks like… watch out for Total3.”
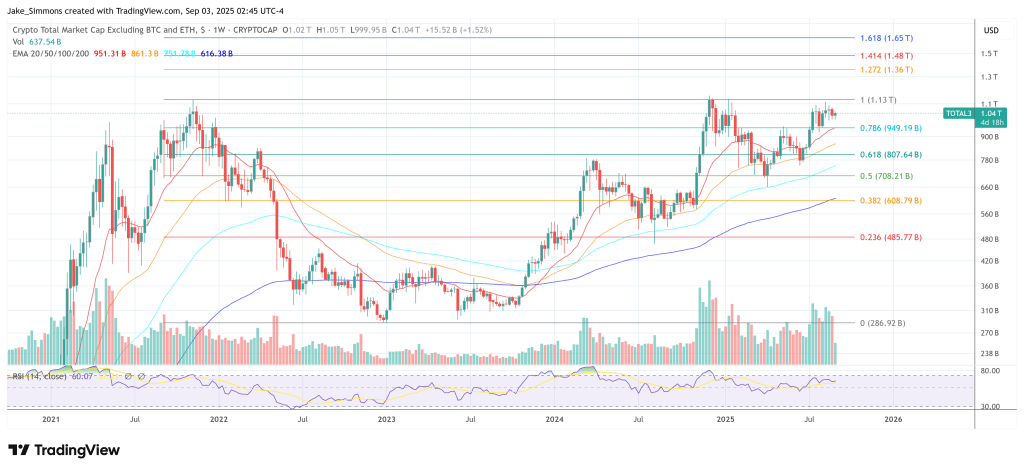
At press time, TOTAL3 stood at $1.04 trillion.
Featured image created with DALL.E, chart from TradingView.com


