
Key points:
-
Bitcoin market analysis sees a squeeze toward $114,000 in time for the weekly close.
-
Traders favor a BTC price rebound into next week.
-
The Bitcoin bull market uptrend can remain intact despite the $19 billion liquidation cascade.
Bitcoin (BTC) centered on $112,000 into Sunday’s weekly candle close as traders hoped for a BTC price comeback next.
Bitcoin liquidation “fishing” due into weekly close
Data from Cointelegraph Markets Pro and TradingView showed volatility cooling after the shock of a $19 billion crypto liquidation event.
BTC/USD failed to deliver a major recovery, but market participants saw next week offering stronger performance.
“Can see case of a relief bounce going into weekly open / futures open,” trader Skew wrote in his latest commentary on X.
“Both always bring important flows from the aspect of a macro backdrop as we currently have. Plus thin market atm so careful with margin positions especially in alts.”
Fellow trader HTL-NL hinted that while the market remained unpredictable, the risk of a serious crash was low.
“You never know what the W close and next week will bring of course, especially since legacy barely had time to respond to Trump,” he told X followers.
“However, I am not overly worried. Everything was poised for a correction anyways, but it all got amplified and we had a system break down.”
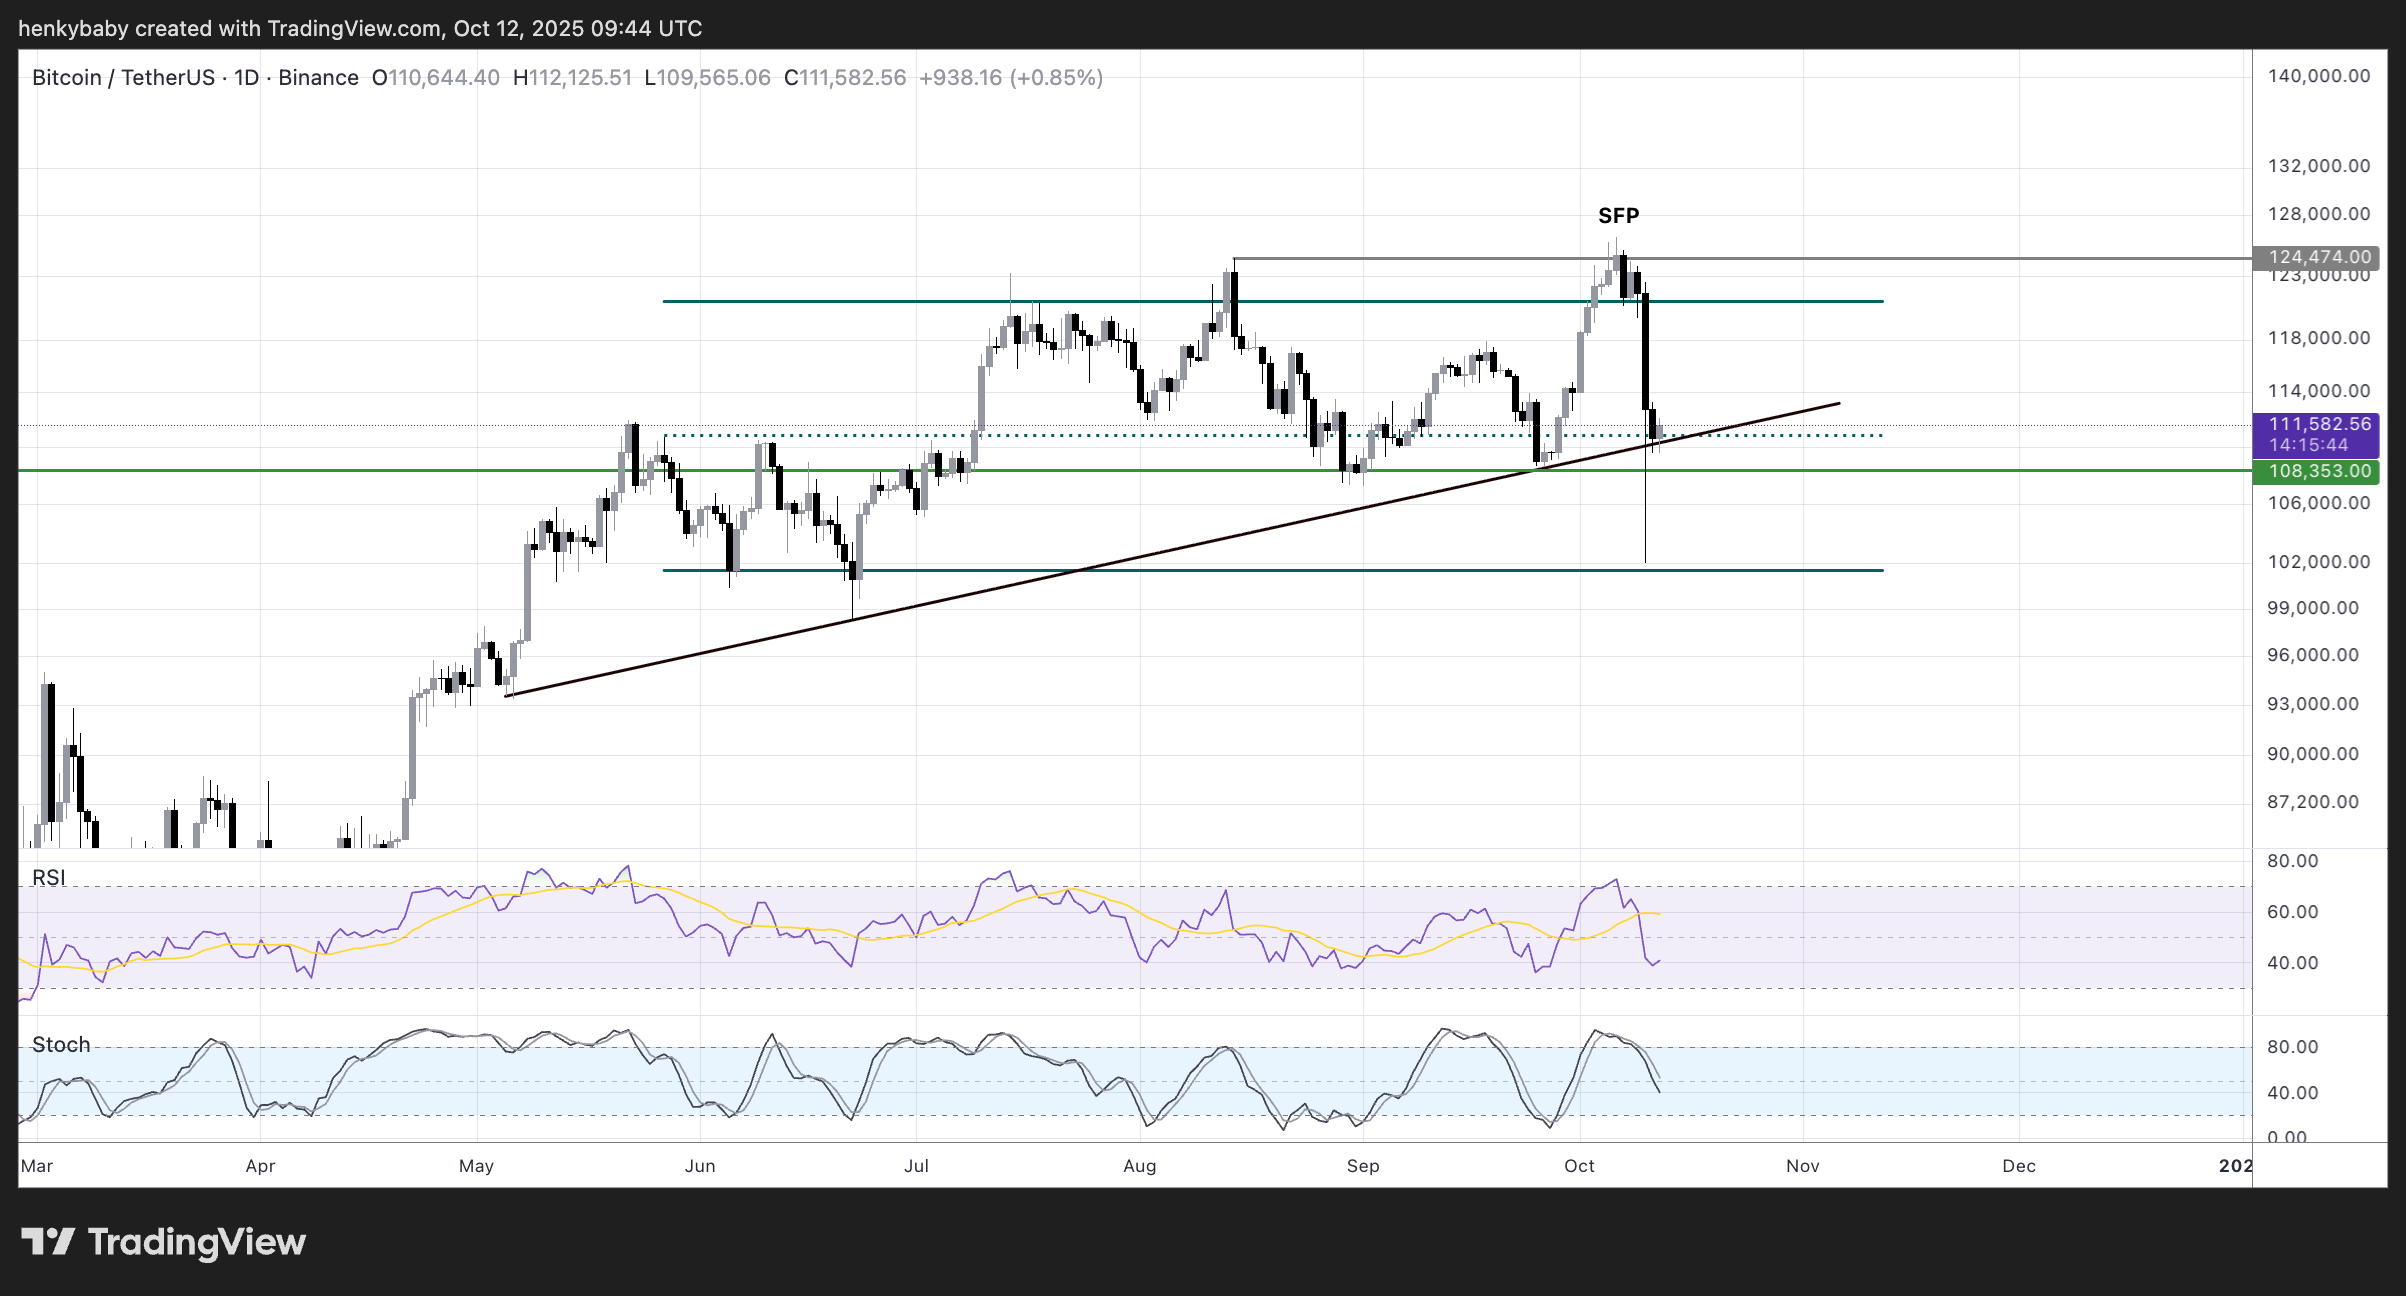
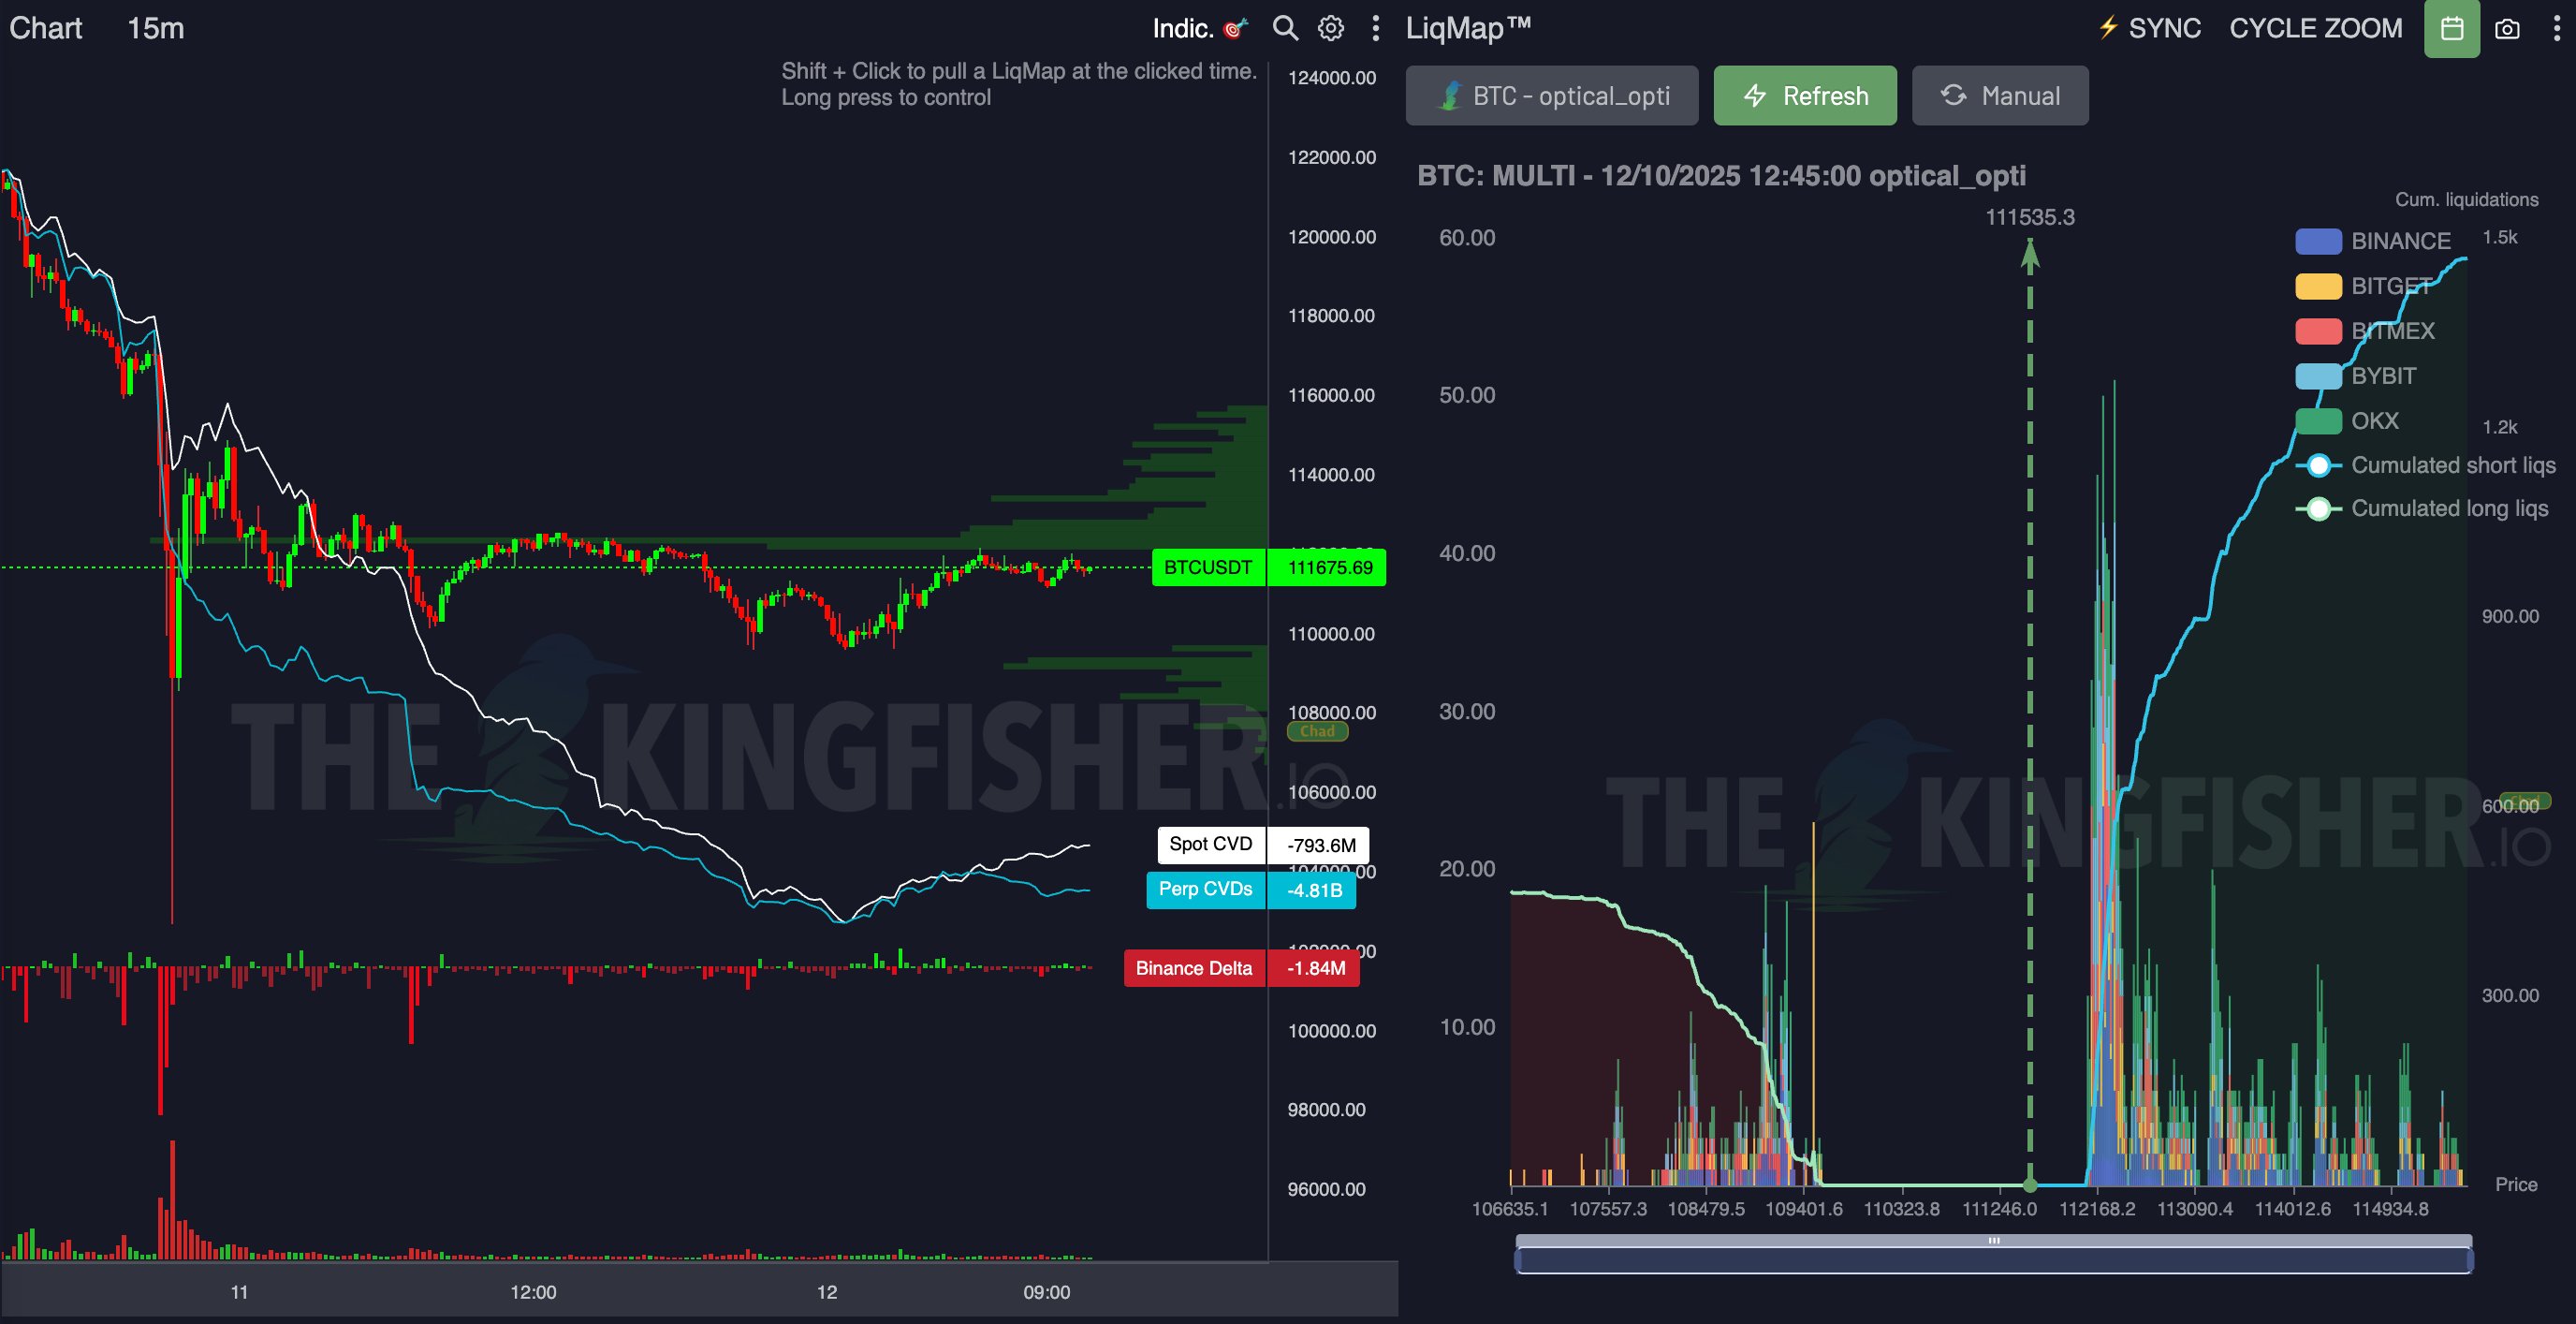
Trading resource TheKingfisher eyed a potential liquidity grab centered around the $114,000 area, with traders heavily short on BTC.
“Weekends are for $BTC range liquidations fishing,” it wrote on the day alongside proprietary market data.
Analyst on BTC bull market: “Bearish things can happen”
Caleb Franzen, creator of financial research resource Cubic Analytics, was even more bullish.
Related: Bitcoin’s ‘macro whiplash,’ Shuffle suffers data breach: Hodler’s Digest, Oct. 5 – 11
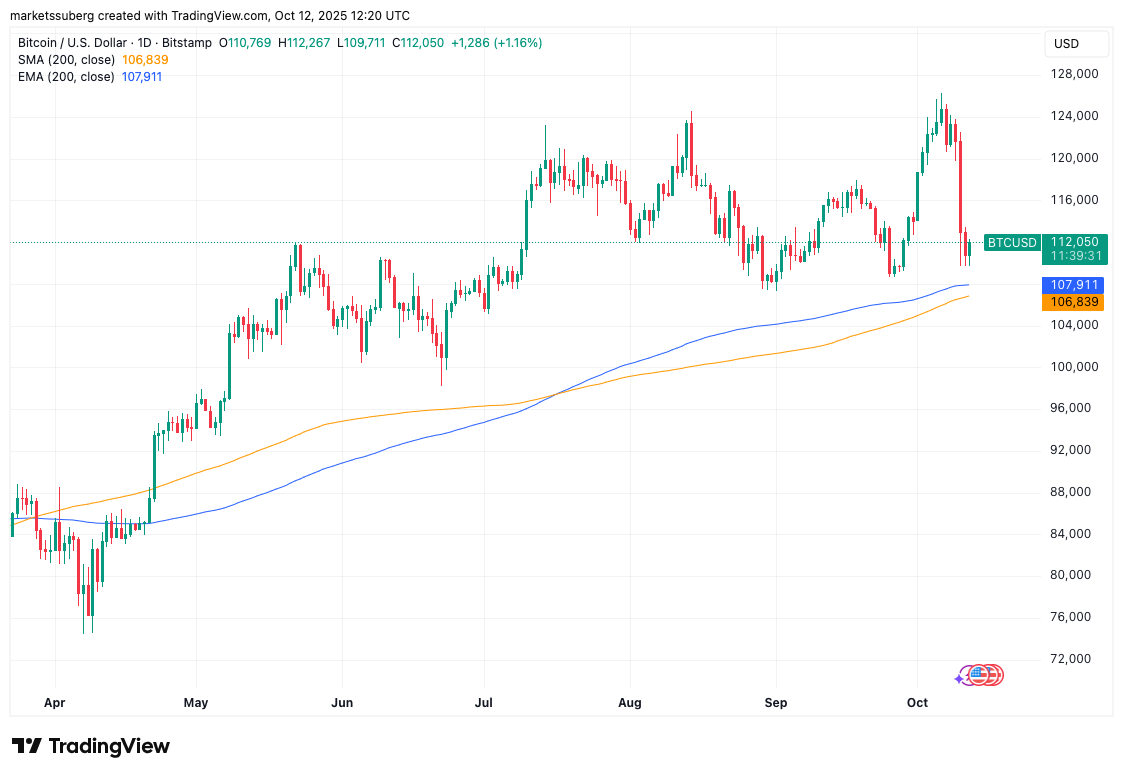
In his latest Substack post, he eyed Bitcoin’s interaction with its simple (SMA) and exponential (EMA) 200-day moving average.
“Maybe prices fall further from here,” he argued.
“Similar to the consolidations that occurred in August-September 2023, July – September 2024, and February – April 2025, it would be completely normal for a brief decline below the 200-day MA cloud before a reclaim and trend continuation to new highs.”
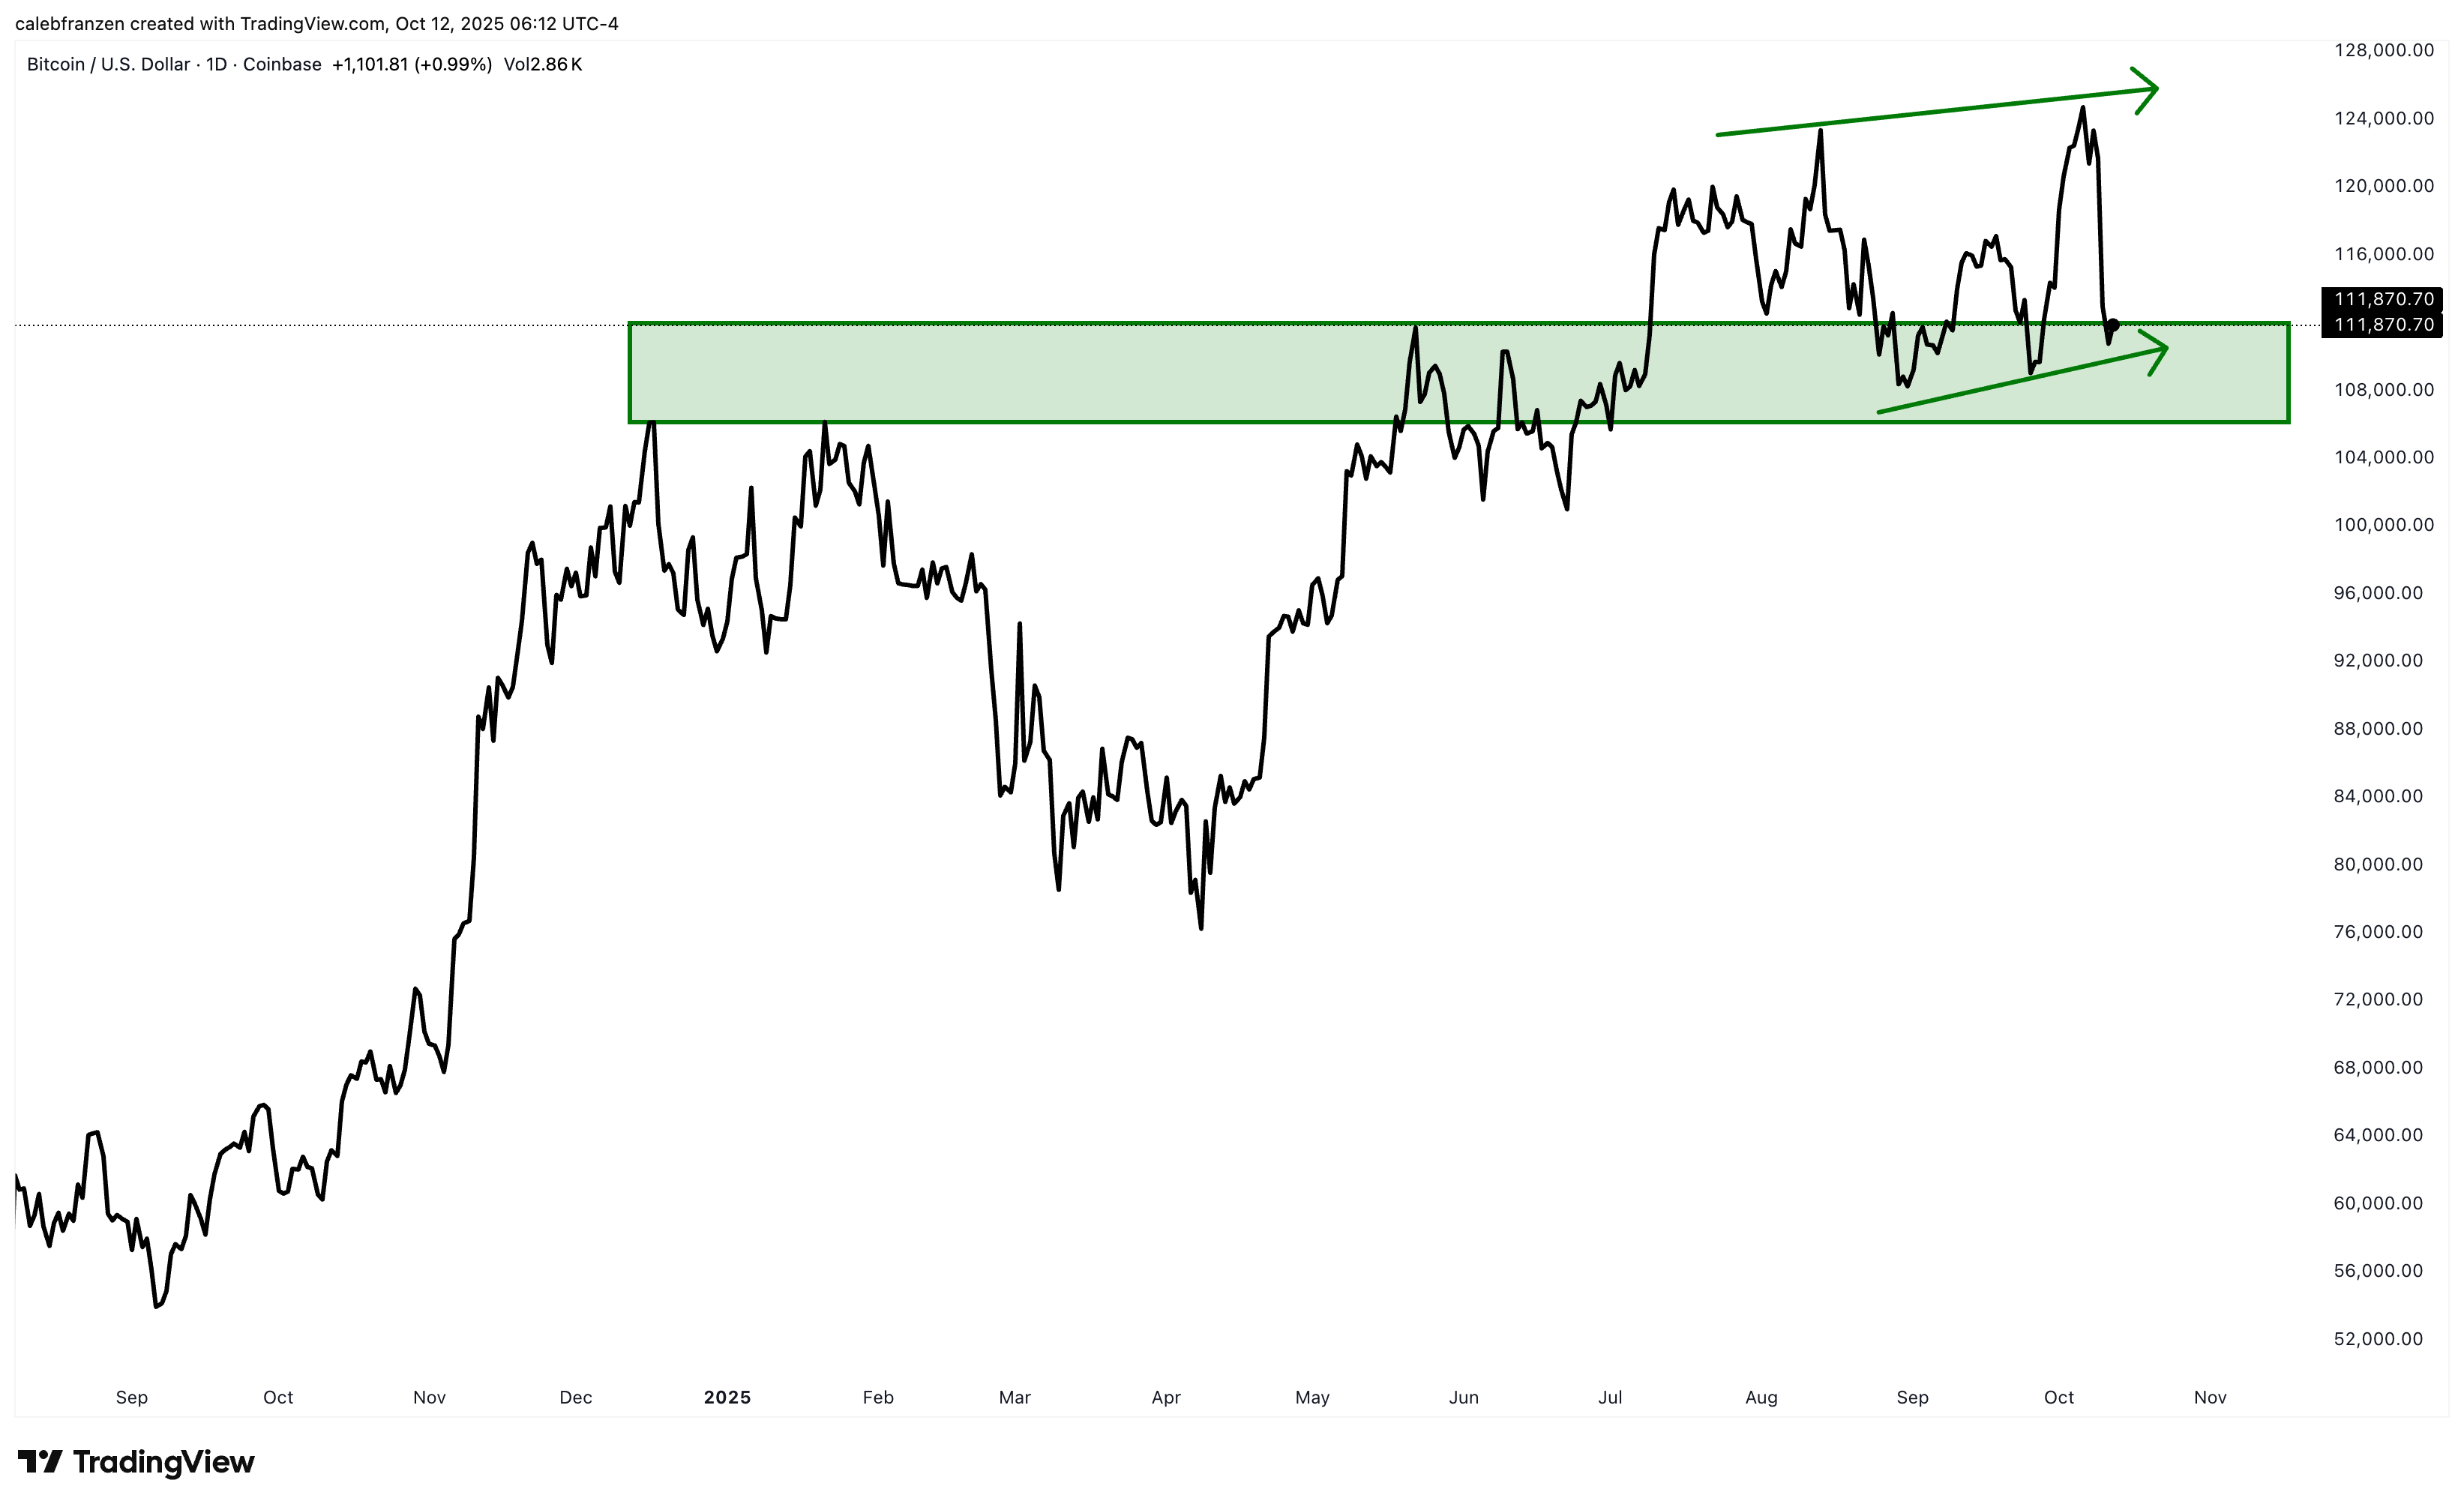
Despite that, BTC/USD could still print a higher low on daily timeframes — something that Franzen said would leave the uptrend intact.
“If uptrends are just the production of higher highs & higher lows, then nothing about this consolidation has invalidated the uptrend,” he added.
“While we must accept that bearish things can happen during uptrends, as this past week proved, it’s also vital to accept that being bearish during an uptrend is a great way to lose money and/or underperform.”
This article does not contain investment advice or recommendations. Every investment and trading move involves risk, and readers should conduct their own research when making a decision.


