XRP is holding firm on the weekly time frame despite the latest market-wide drawdown, according to an Elliott Wave roadmap shared by crypto technician Hov (@HovWaves).
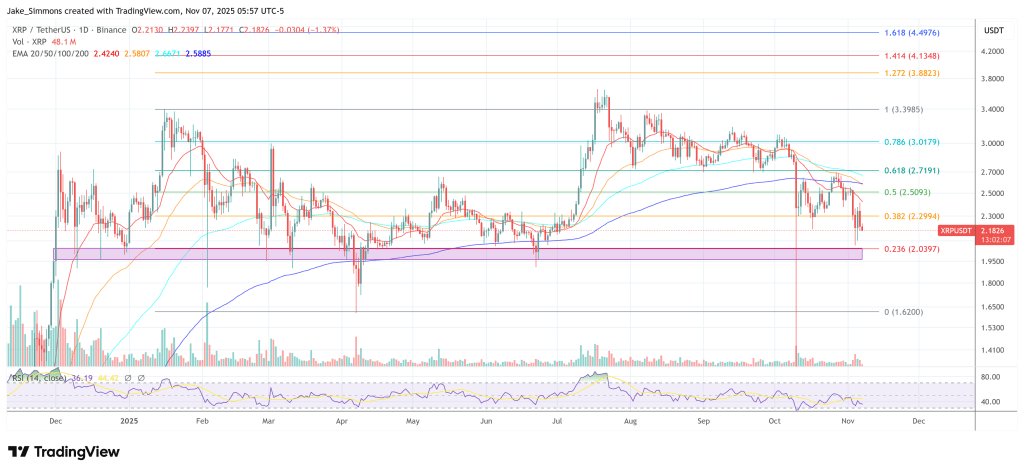
On Hov’s Bitstamp-based 1W chart, the current candle sits near $2.22 with three days and several hours left to close, and the structure remains nested inside a higher-time-frame impulse that he counts as wave iii completed, wave iv in progress, and a prospective wave v aiming materially higher.
Is The XRP Bottom In?
The key reference band for pullbacks is defined by Fibonacci retracements measured from the latest vertical advance. Hov plots the 0.236 retracement at $2.094, the 0.382 at $1.548, the 0.5 at $1.213, and the 0.618 at $0.950.
The price has broken down to the 0.236 neighborhood, probing a turquoise demand box that overlaps the 0.382 ($1.548) on the lower edge. That zone also contains the October 10 liquidity event wick he highlights around $1.58. In his accompanying note, Hov stresses that the last rise from that low has only formed three waves to date, leaving room for “one more small low on the micro before it’s all said and done,” while adding, “I don’t think it takes out the 1.58 low” and that, because of the wick, “we’re likely to see a truncation on this move.”
Related Reading
The upside map hinges on two resistance landmarks. First is a boxed supply region overhead that caps out just below a labeled swing marker at “0 (3.41159),” effectively framing $3.41 as the final pivot from the prior leg. More important for confirmation, Hov marks “HTF close above $2.94 is the key.” That $2.94 weekly close is his validation level that would reassert the impulsive trend and unlock a measured extension to his first target.
That target is explicit on the chart: the next leg’s objective aligns with the −0.236 extension printed at $5.558. A curved projection path from the current area arcs through the retracement box and then accelerates vertically toward the target, annotated with a circled “V” at the terminal portion of the move and a higher-degree “3” on the scale, consistent with an impulse termination at or near the extension.
Related Reading
Context from the left side of the chart shows how structurally important the base has been. A broad turquoise accumulation band anchored around the $0.43 handle (labeled “1 (0.43128)”) held price throughout 2023–2024, preceding the breakout that staged the current impulse.
Above that, a second, higher turquoise band spans the 2021 reaction zone and now acts as the battleground for the present consolidation beneath $3.41. A visible-range profile overlay inside the consolidation rectangle shows the heaviest traded activity toward the left ridge of the range, underscoring why weekly closes above $2.94 would be decisive.
Hov’s bottom line on X mirrors the chart. “XRP holding up exceptionally well on this market wide sell off,” he wrote, noting the coin remains “still up 40% off our level (threaded).” While he allows for a final marginal low—without undercutting $1.58—his roadmap retains a “first target” near $5.5, with the caveat that a “HTF close above $2.94 is the key.”
At press time, XRP traded at $2.18.
Featured image created with DALL.E, chart from TradingView.com


