
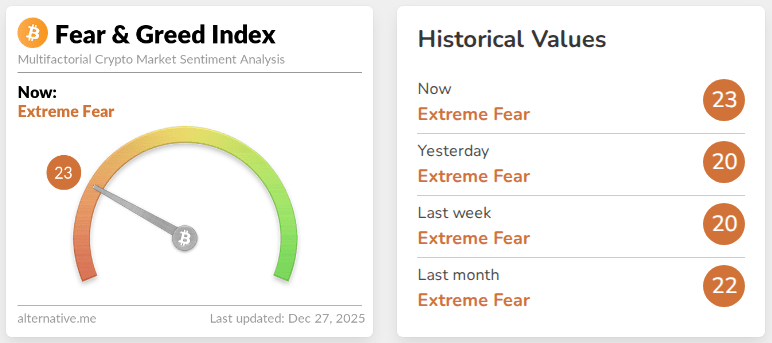
According to reports, Bitcoin’s outlook for 2026 is sharply divided as traders close the year. The coin was trading at $87,520 at the time of publication and is down 8% since Jan. 1, year to date. Market mood has been weak. The Crypto Fear & Greed Index hit 20 on Dec. 26, marking a stretch of two weeks labeled “extreme fear.”
Related Reading
Analysts Split On Market Direction
According to posts on X, Jan3 founder Samson Mow contend that 2025 was the bear market and that Bitcoin could be entering a bull run that lasts into 2035.
PlanC, another well-known analyst, posted that Bitcoin has never had two red yearly candles in a row and suggested that surviving 2025 meant surviving the bear phase. Those comments have been picked up across industry pages and sparked fresh debate.
2025 was the bear market. https://t.co/1ganX0YSbI
— Samson Mow (@Excellion) December 26, 2025
Some Big Price Calls Remain Bullish
Several prominent voices still expect sharp gains. Geoff Kendrick at Standard Chartered and Gautam Chhugani at Bernstein each forecast $150,000 for Bitcoin in 2026.
Charles Hoskinson, founder of Cardano, predicted $250,000 by 2026, pointing to constrained supply and rising institutional demand as the main drivers.
Arthur Hayes and Tom Lee also pushed big targets as recently as October, with $250,000 mentioned as a possible outcome by year-end.
Sentiment And Market Data
Based on reports, sentiment readings have not helped bullish momentum. The fear index that reached 20 on Dec. 26 stayed in “extreme fear” territory for multiple days.
At the same time, Bitcoin’s price sits below many earlier projections. Market watchers note the coin is under pressure even though several forecasts remain optimistic.

Bears Put Forward Sharp Downside Scenarios
Mike McGlone, senior commodity strategist at Bloomberg Intelligence, expects a decline of roughly 60% from the historical peak above $126,000 by 2026.
Jurrien Timmer of Fidelity warned that 2026 could be a “year off,” with prices possibly falling toward $65,000. Those views rely heavily on historical drawdowns and macro headwinds.
They carry weight because large drops have happened before, though past behavior does not guarantee future action.
Where The Numbers Diverge
The spread of projections is wide. Some firms suggest about $150,000, which would represent roughly 74% upside from a cited $86,000 level.
Others point to $250,000, while downside scenarios reach $65,000 or worse when measured from the $126,000 peak.
That gap shows how different assumptions about supply, demand from institutions, and macro conditions lead to very different price targets.
Related Reading
Traders and asset managers will be watching flows into regulated products, corporate treasury moves, and changes in on-chain demand. Headlines and big calls make for talk, but actual flows often decide short-term moves.
Volatility is likely to remain, and the wide range of forecasts suggests that both sharp rallies and sudden drops are possible in 2026.
Featured image from Pexels, chart from TradingView


