A long-term bitcoin price resistance has flipped to become support for what appears to be a potential bullish action.
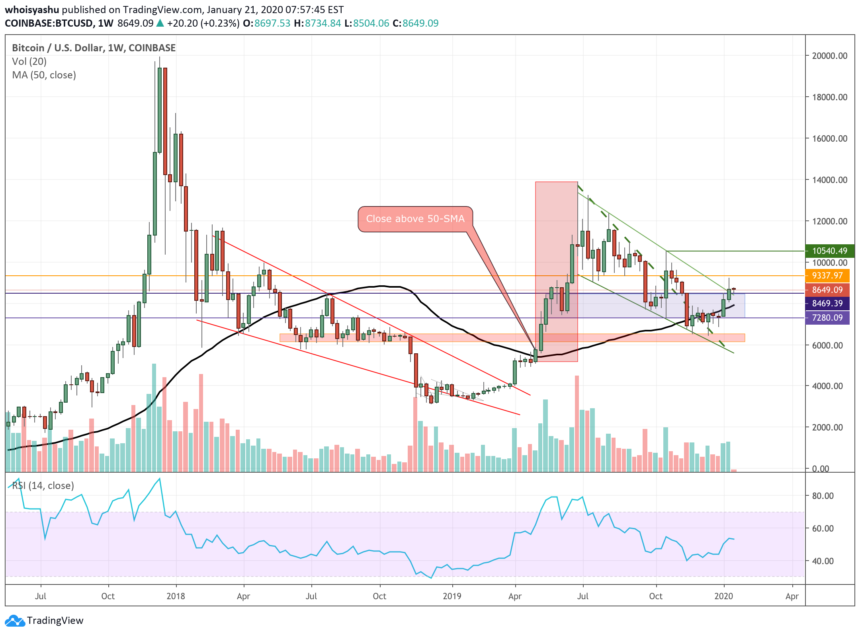
The 50-weekly moving average (50-SMA), which measures the average of bitcoin prices over a 50-week period, looks to assume the role of a strong pullback level. The year’s first week marked the first time price closed above the technical indicator since late-April, as shown in the chart below.

Bitcoin looks to continue price rally above blacked support wave | Source: TradingView.com, Coinbase
A crossover above the 50-SMA earlier in April pushed the bitcoin price up by 173 percent to $13,868.44 on Coinbase exchange. Meanwhile, the resistance-to-support flip of the blacked support wave accompanied the growth in weekly trade volume, confirming the cryptocurrency’s breakout action.
The latest upside push in the bitcoin price served a reminiscent of the same upside move. The volumes further went up to confirm a breakout sentiment, confirming that traders were looking to behold the 200-SMA wave as their medium-term support.
Strong Fundamentals in Both Cases
The S/R flips noted across the 2019’s and current price actions borrowed sentiments from global conflicts.
Last year, bitcoin swelled against the escalation in the trade war between the US and China, furthered by the weakening of the Chinese Yuan and the launch of Facebook’s crypto-inspired payment project Libra.
There is a lecture about crypto (mostly bitcoin and Libra, Facebook and Twitter) and how money is becoming digitalized on KBS, the national broadcaster of Korea, at prime time.
Regardless of price, awareness has increased a lot and in the new decade, adoption should follow. pic.twitter.com/5V10o1gDih
— Joseph Young (@iamjosephyoung) January 16, 2020
This year, on the other hand, bitcoin surged as the US raised conflicts in the Middle East after killing a top Iranian military commander on January 3. Furthermore, fears of a weak corporate earnings report coupled with the Federal Reserve’s balance sheet expansion kept investors’ appetite for risk-off assets alive.
The events, more or less, benefited bitcoin, a pseudo-safe-haven asset.
The Bitcoin Bull Trap Theory
Experienced analysts might rubbish the role of 50-SMA in determining bitcoin’s medium-term bias based on the latest price actions. Throughout December, the cryptocurrency briefly closed above the wave resistance only to pullback sharply at later stages.
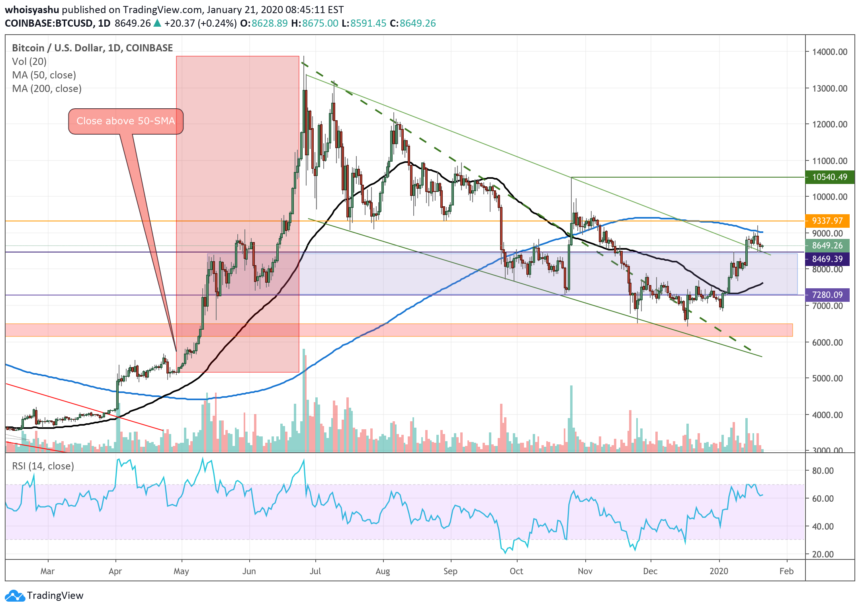
So it appears, bitcoin may have stretched itself a little too far above the 50-SMA in the latest case. The cryptocurrency is already showing signs of buyers’ exhaustion, leading to a minor downside correction. It is now down by 5 percent from its local top of $9,194.
The bitcoin daily chart explains the interim downside sentiment better. In it, the price is struggling to close above its ‘blued’ 200-daily moving average, another bias-defining indicator for the near-term trades.
The price could invalidate the bull trap should it closes above the 200-daily MA with huge growth in trade volume. More so, the weekly timeframe indicates that bitcoin could retest its all-time high of circa $20,000 on the next upside run.


