
In a recent analysis shared on X (formerly Twitter), crypto analyst Michaël van de Poppe offered an insightful perspective on the current state of the altcoin market. His analysis draws parallels with historical trends, suggesting that the current corrections in altcoins may present strong buying opportunities for investors.
Buy The Altcoin Dips Now?
Van de Poppe’s analysis began by noting the ongoing corrections in the altcoin sector, which he interprets as part of a sustained uptrend. “Altcoins have multiple days/weeks correction while still in an uptrend,” he stated, indicating that these periods are not only natural but also beneficial for the market’s overall health.
He further explained the dynamics of these corrections, emphasizing their historical significance. “This [current] period is very heavily comparable to the period we experienced at the end of 2015, or at the end of 2019,” van de Poppe mentioned. He drew specific attention to Ethereum’s remarkable run from $1 to $14 in late 2015, which eventually led to a peak of $1,400 in 2017, demonstrating the potential for massive returns.
Van de Poppe’s analysis also touched upon the concept of higher timeframe support zones. He elucidated that during initial upward runs, corrections to these support zones offer ideal re-entry points for investors. “During the run in 2020, we’ve seen the DeFi summer taking place, which has a high chance of coming back to the surface in 2024,” he added, hinting at a potential bull run in the coming months.
A significant part of his analysis involved a detailed comparison between Ethereum’s price action and that of other altcoins like Chainlink and Arbitrum. He noted, “If you compare the price action of Ethereum with the current price action of Chainlink, you’ll see that it’s just barely having a correction of 20%.” He suggested that further corrections could provide even clearer trends and entry points for investors.
Van de Poppe also emphasized the importance of time frames in analyzing these trends. “If you start to zoom in on the 1h, or 4h, or 15m timeframe, you’ll spot those trends as well. It’s just a matter of time frame,” he explained.
Chainlink And Arbitrum Entry Zones
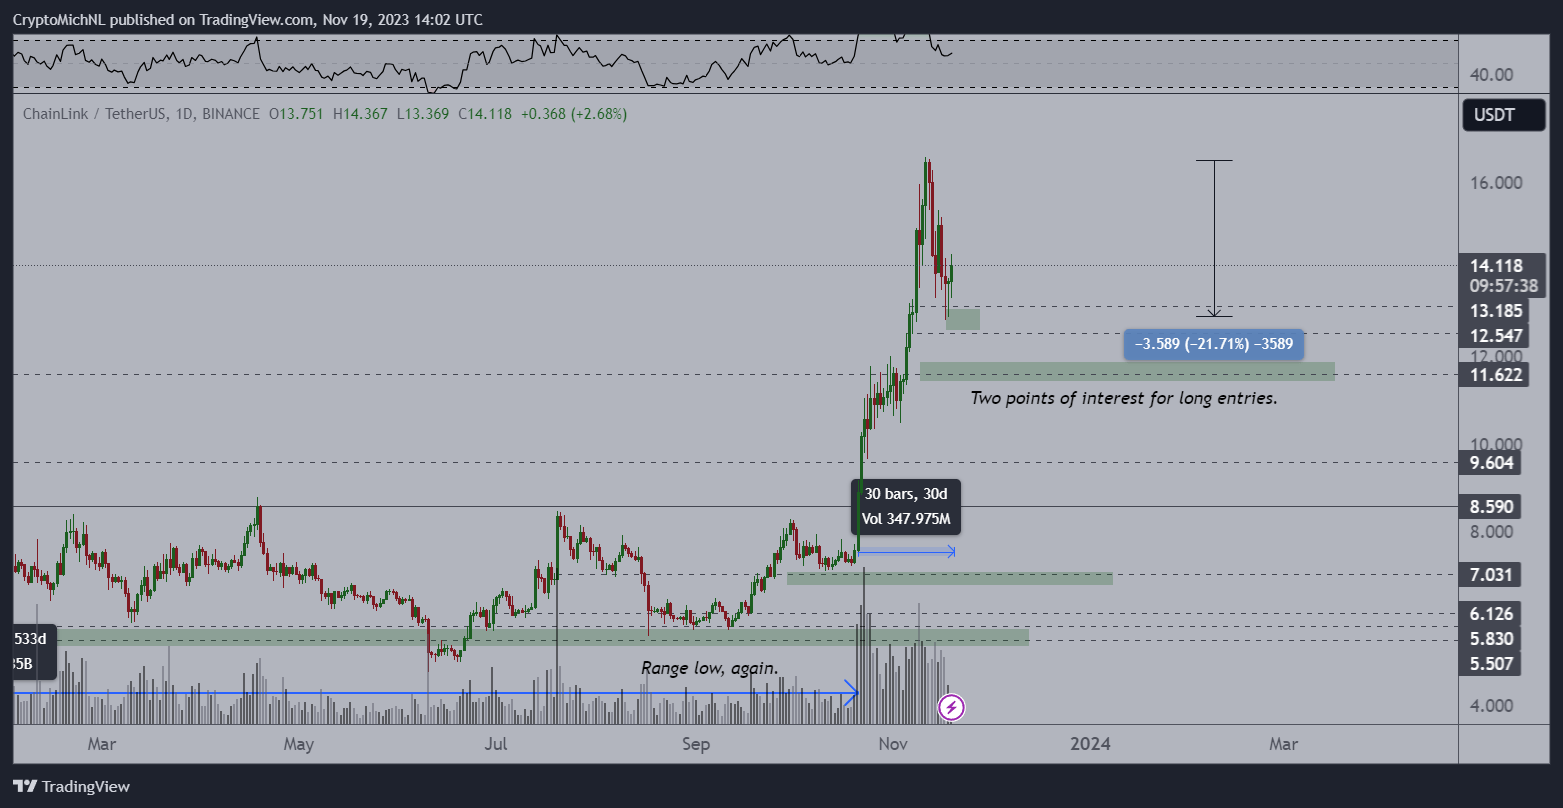
Looking at the LINK/USD 1-day chart, van der Poppe remarked, “Arguments can be made that we’re barely at the start of this first upwards wave of the cycle as this rally of Chainlink lasted less than 5 weeks.”
As the crypto analyst shows, Chainlink has already undergone a correction of -21.7%. According to him, there are two points of interest for a possible entry, in the range from $12.54 to $13.18 and around $11.62.
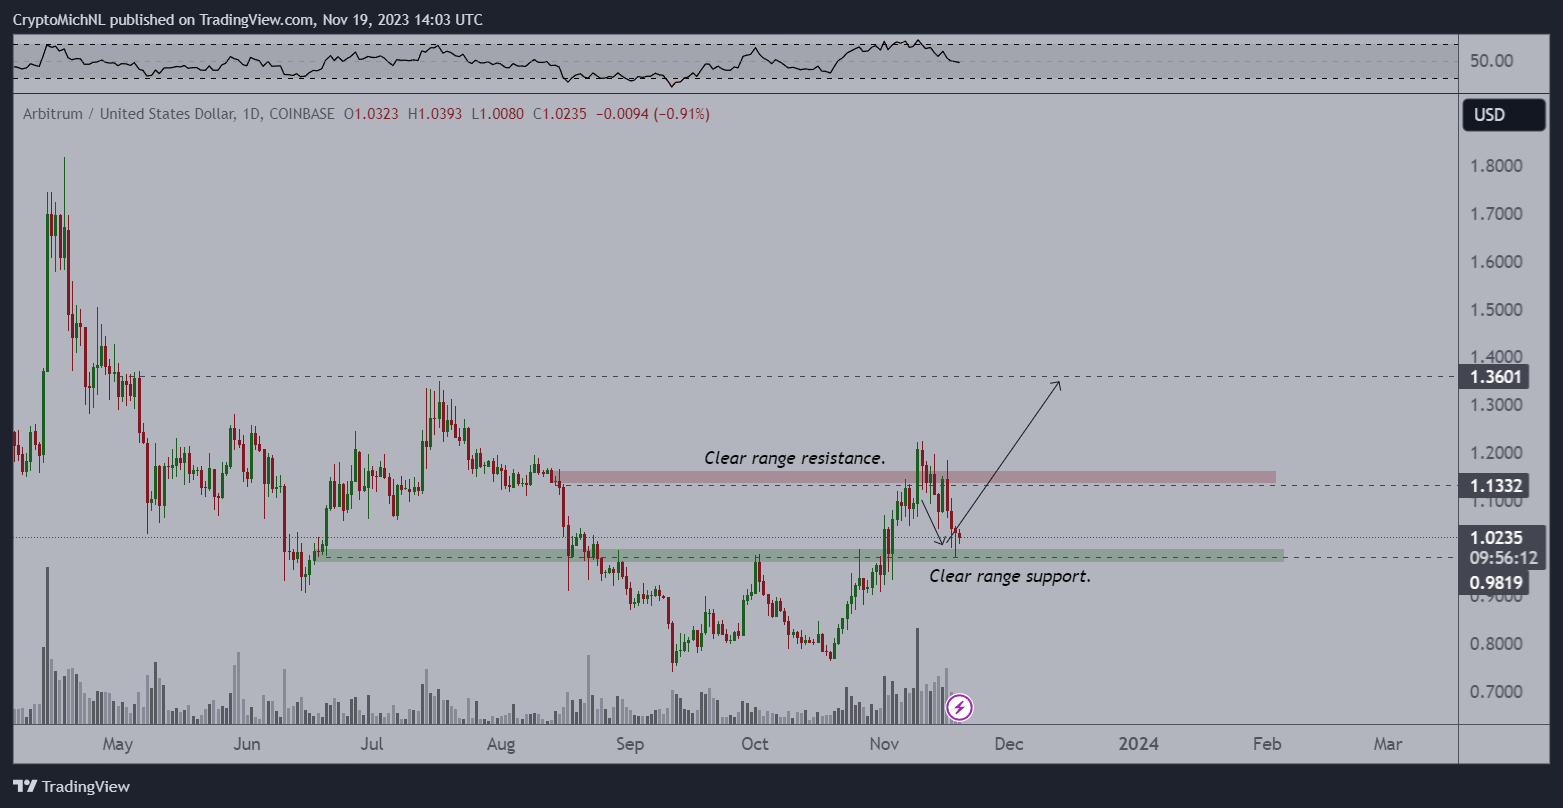
“Another example is Arbitrum, which is currently resting on support and, just like the rest of the markets, is providing a corrective move,” stated van der Poppe. The analyst identifies a “clear range support” at $0.98 in the 1-day chart of ARB/USD.
In conclusion, Michaël van de Poppe’s analysis presents a compelling case for considering altcoin corrections as potential opportunities for investment. His concluding advice to investors is “Don’t be afraid, if an altcoin drops between 30-50% at this stage of the cycle, time to look for your entries.”
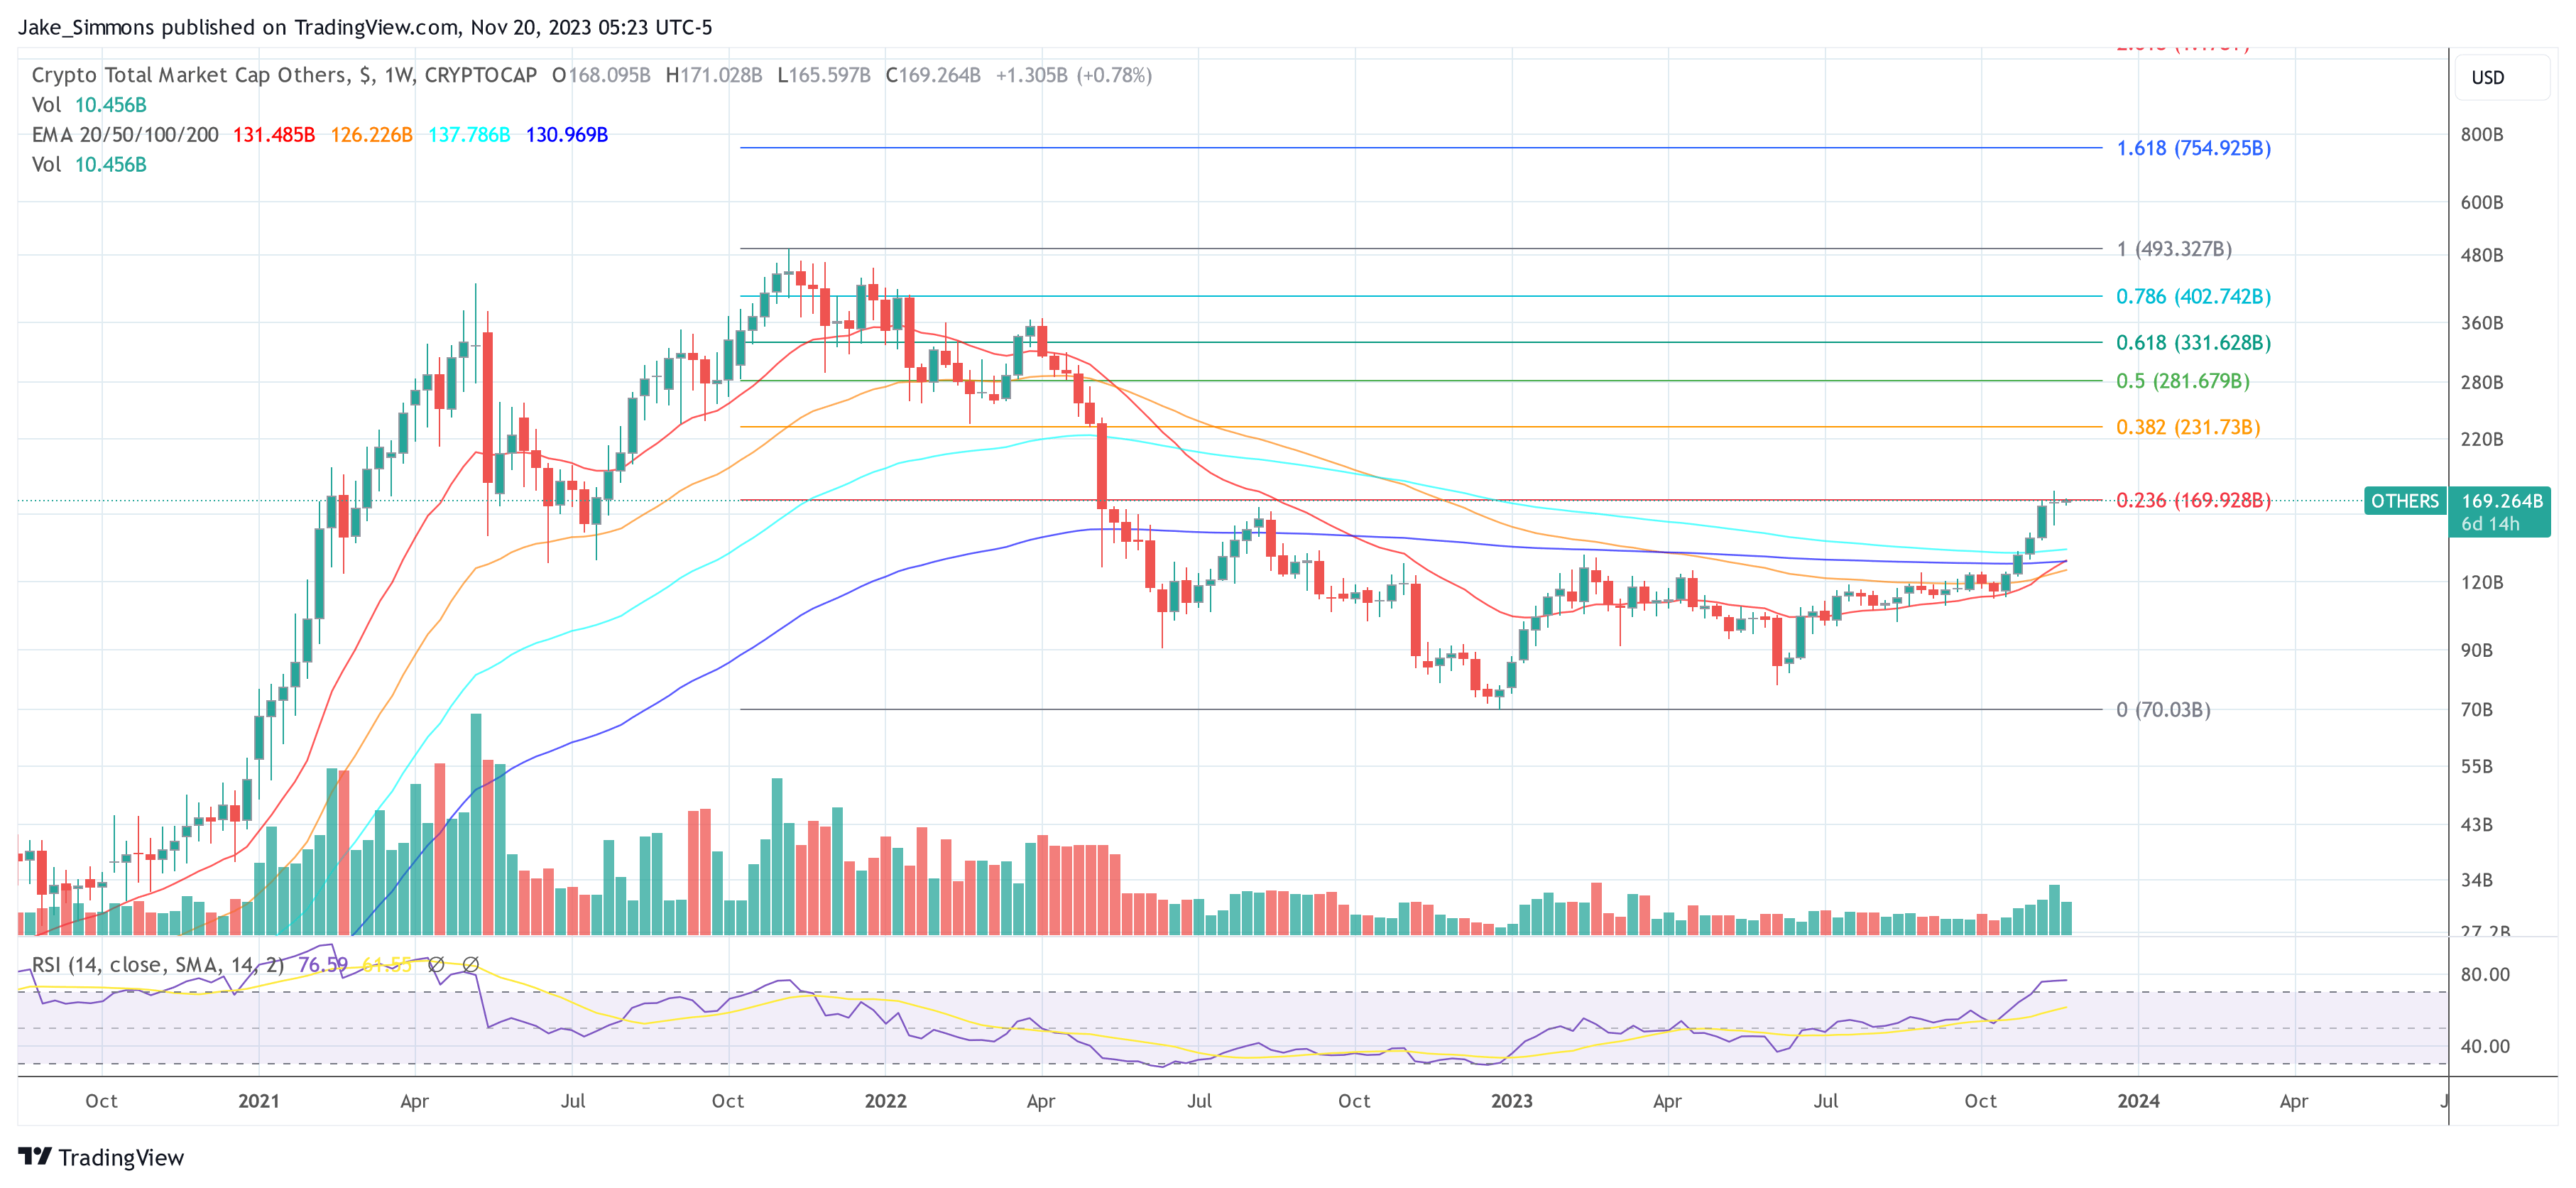
At press time, the total altcoin market cap stood at $169.264 billion, just below the crucial 0.236 Fibonacci retracement level of $169.928 billion. A break above this resistance could be a major bullish signal.
Featured image from Shutterstock, chart from TradingView.com


