Reason to trust
Strict editorial policy that focuses on accuracy, relevance, and impartiality
Created by industry experts and meticulously reviewed
The highest standards in reporting and publishing
Strict editorial policy that focuses on accuracy, relevance, and impartiality
Morbi pretium leo et nisl aliquam mollis. Quisque arcu lorem, ultricies quis pellentesque nec, ullamcorper eu odio.
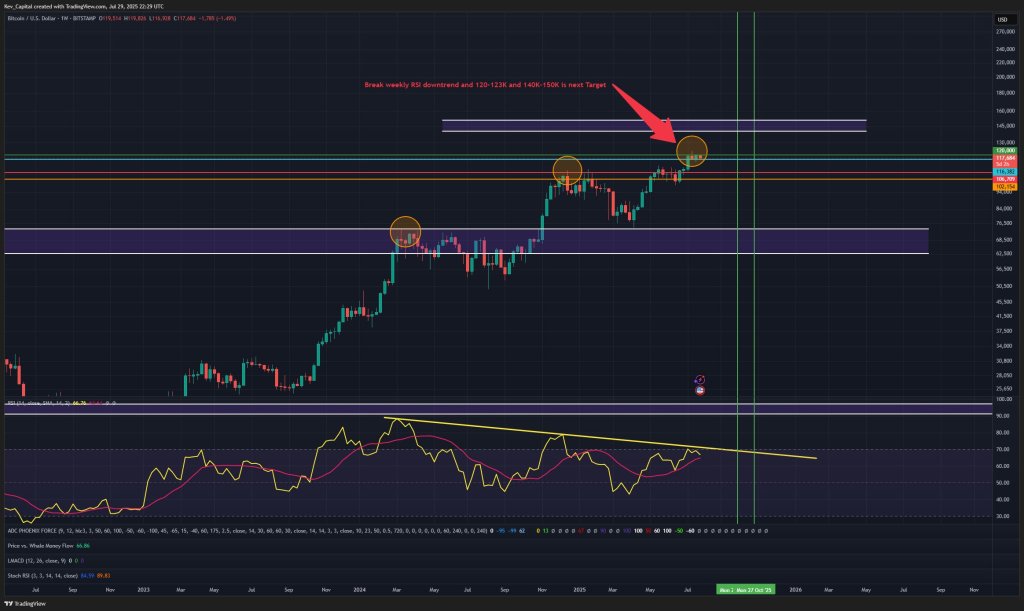
A closely watched technical analyst says the outlook for altcoins will remain precarious until Bitcoin breaks through a well-defined ceiling between $120,000 and $123,000, arguing that the weekly chart still commands caution while momentum lags.
Why Altcoins Are Still In The Danger Zone
Kevin (@Kev_Capital_TA) framed the current setup bluntly: “This weekly BTC chart remains the most important chart out there for us to examine. While below the 120–123K zone and the weekly downtrending resistance on the weekly RSI I have to remain cautious.” He added that he would be “the most bullish person on the timeline” once those levels are cleared, but “until then we treat it for what it is and that is major resistance.”
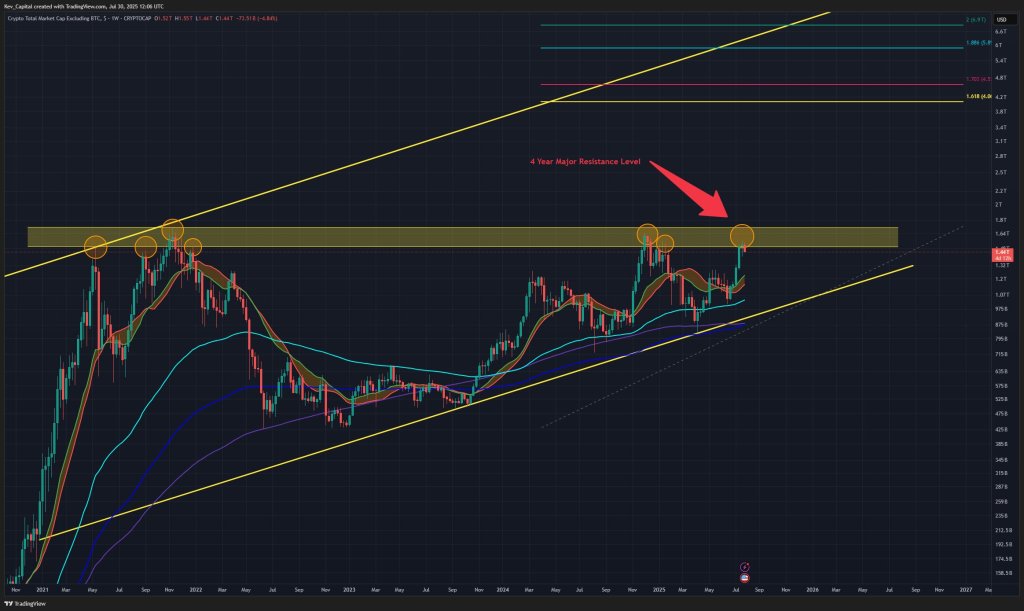
Kevin’s read ties the altcoin path directly to Bitcoin’s ability to punch higher. In a follow-up post, he warned that sentiment had flipped at precisely the wrong places: “Most of the #Crypto timeline got max bullish at 4 year historical resistance and was max bearish at major support back in April and even June.”
Related Reading
The implication, he suggested, is to avoid chasing optimism under resistance and to “air on the side of caution while #BTC and Total 2/#ETH remain under these major levels.” By referencing Total2—the market capitalization of crypto excluding Bitcoin—and Ethereum, Kevin effectively argued that the broader risk-on impulse for altcoins is unlikely to sustain without a decisive Bitcoin breakout.
Macro conditions are a swing factor in his framework, but not yet a catalyst. “The July FOMC was always going to be lack luster with not much stake,” he wrote, noting that two more rounds of data arrive before the September meeting and that “projections are roughly 50/50.” He pointed traders to Core PCE as the next waypoint, while reiterating that he’ll “be the most bullish” only if price and momentum confirm above the highlighted band. Until then, he plans to “manage risk properly and sit back and watch the show unfold.”
Related Reading
Market structure and volatility may force the timeline. “#BTC getting ready to make a move soon after volatility has dropped off a cliff over the last week,” Kevin observed, underscoring that compressed ranges typically precede directional expansion.

In his view, that expansion must come with a break of both price resistance and the “downtrending resistance on the weekly RSI” to unlock the stronger bullish case. Without that confluence, he sees the set-up as a classic trap for altcoins, which historically underperform when Bitcoin is capped and dominance grinds higher within ranges.
Kevin’s stance, delivered across posts on July 30–31, amounts to conditional optimism: the structural bull case for the asset class remains intact only if Bitcoin proves it by clearing the $120,000–$123,000 zone and reversing its weekly momentum profile. “Just be careful who you follow folks,” he cautioned. “There is some good ones but a lot of bad ones.”
For now, he remains explicitly cautious on altcoins while Bitcoin and the major breadth gauges sit beneath those levels, with the next decisive tests likely to be driven by the data cadence into September and a volatility breakout that finally chooses a side.
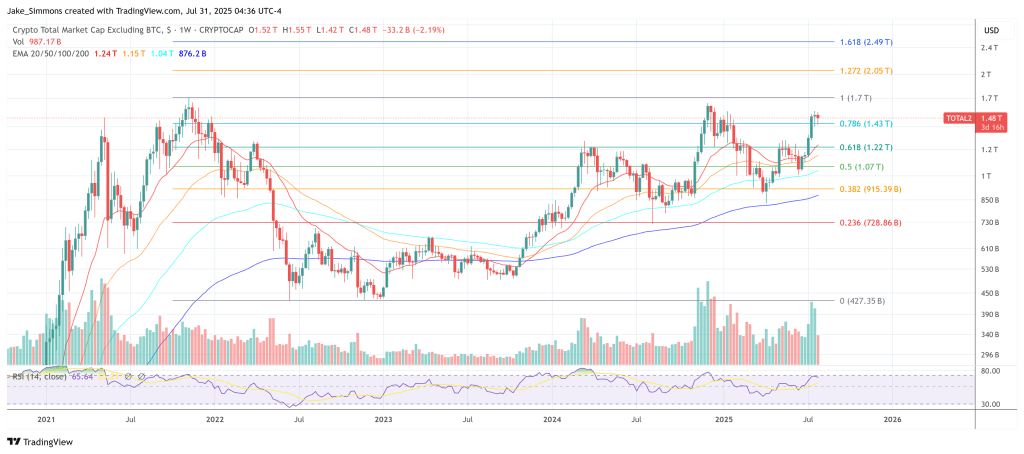
At press time, the total altcoin market cap (TOTAL2) stood at $1.48 trillion.
Featured image created with DALL.E, chart from TradingView.com


