
Despite initial expectations of a steady price increase and a robust bull run this year, Bitcoin (BTC) has suffered severe declines, pushing its price below the $60,000 threshold. Due to the cryptocurrency’s prolonged bearish performance, a crypto analyst has warned that Bitcoin could decline even further, predicting a potential crash below $40,000. However, the analyst also provides a silver lining to his bearish outlook, anticipating a major rebound after the decline.
Bitcoin May Be Headed For A $40,000 Crash
A crypto analyst known as ‘Magog PhD’ took to X (formerly Twitter) on September 1 to share a unique encounter he had with a supposed Bitcoin billionaire. The analyst recounted an unusual experience from his summer job as a waiter in a New York restaurant, where a Bitcoin billionaire slid a piece of paper across the table in the form of a tip.
Related Reading
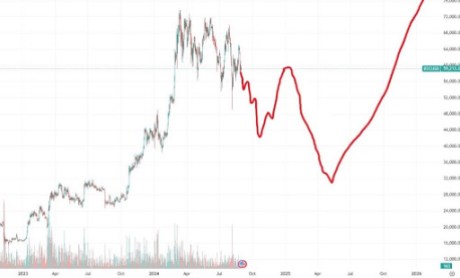
Upon examination the paper revealed a chart forecasting Bitcoin’s future price trajectory. The chart illustrated that Bitcoin’s price was expected to crash below $32,000, marking a massive decline to new lows. Over the past few months the price of Bitcoin has experienced strong volatility and widespread liquidations which have led to severe price decline.
At one stage, the cryptocurrency tumbled by over 20%, plunging below $50,000 before rebounding to nearly $60,000. The demand for Spot Bitcoin Exchange Traded Funds (ETFs) have also seen a sharp decline, likely playing a role in Bitcoin’s recent downward trend.
Although the Bitcoin price chart projects that the cryptocurrency will crash below $32,000, it also illustrated that Bitcoin would potentially witness a major breakout above $76,000 following the decline. Similar bullish sentiment has been shared by fellow crypto analysts in the market.
According to technical analyst and Bitcoin trader, ‘Titan of Crypto,’ Bitcoin is currently forming a unique technical pattern called the “Cup and Handle pattern.” Often recognized as a bullish continuation signal, the Cup and Handle is a technical chart pattern that highlights a period of consolidation after an uptrend, followed by a slight pull back and an eventual breakout to the upside.
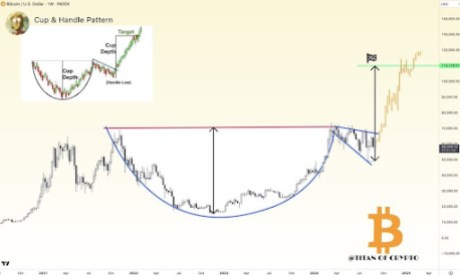
Based on this technical pattern, the analyst believes that Bitcoin is likely to break out soon, reaching a potential price target of $110,000. He disclosed that this bullish price movement could happen in the final quarter of the year, highlighting that the cryptocurrency’s rebound is “going to be epic.”
BTC Achieves Historic Weekly Golden Cross
Bitcoin may have reached a historic milestone, as crypto analyst Jelle has identified the formation of a weekly Golden Cross on the Bitcoin price chart for the first time ever.
Related Reading
The golden cross occurs when a short-term Moving Average (MA) crosses above a long-term MA. This week, Bitcoin’s 100-week MA surpassed the 200-week MA, highlighting a strong bullish signal that could potentially trigger a massive bull run for the cryptocurrency.

Featured image created with Dall.E, chart from Tradingview.com


