Avalanche (AVAX) has displayed recovery on its chart. Over the last 24 hours, the altcoin brought home 4.8% gain. Although, there has been a considerable daily gain, AVAX is trading underneath its long-standing price floor.
It is difficult for investors to look at just the daily gain as a good enough reason to buy the coin at the moment. Technical for the coin hasn’t suggested strong bullishness which might suggest that AVAX could be a good buy at the time of writing.
Avalanche (AVAX) has lost 8% of its market value in the last week. This forced many investors to liquidate the asset and leave. Since, AVAX broke below its long term support area, this could act as an important red flag for the investors.
The next solid area of support for AVAX was at $20. The coin traded around the current price level previously in the month of August, a year ago.
Avalanche Price Analysis: One Day Chart
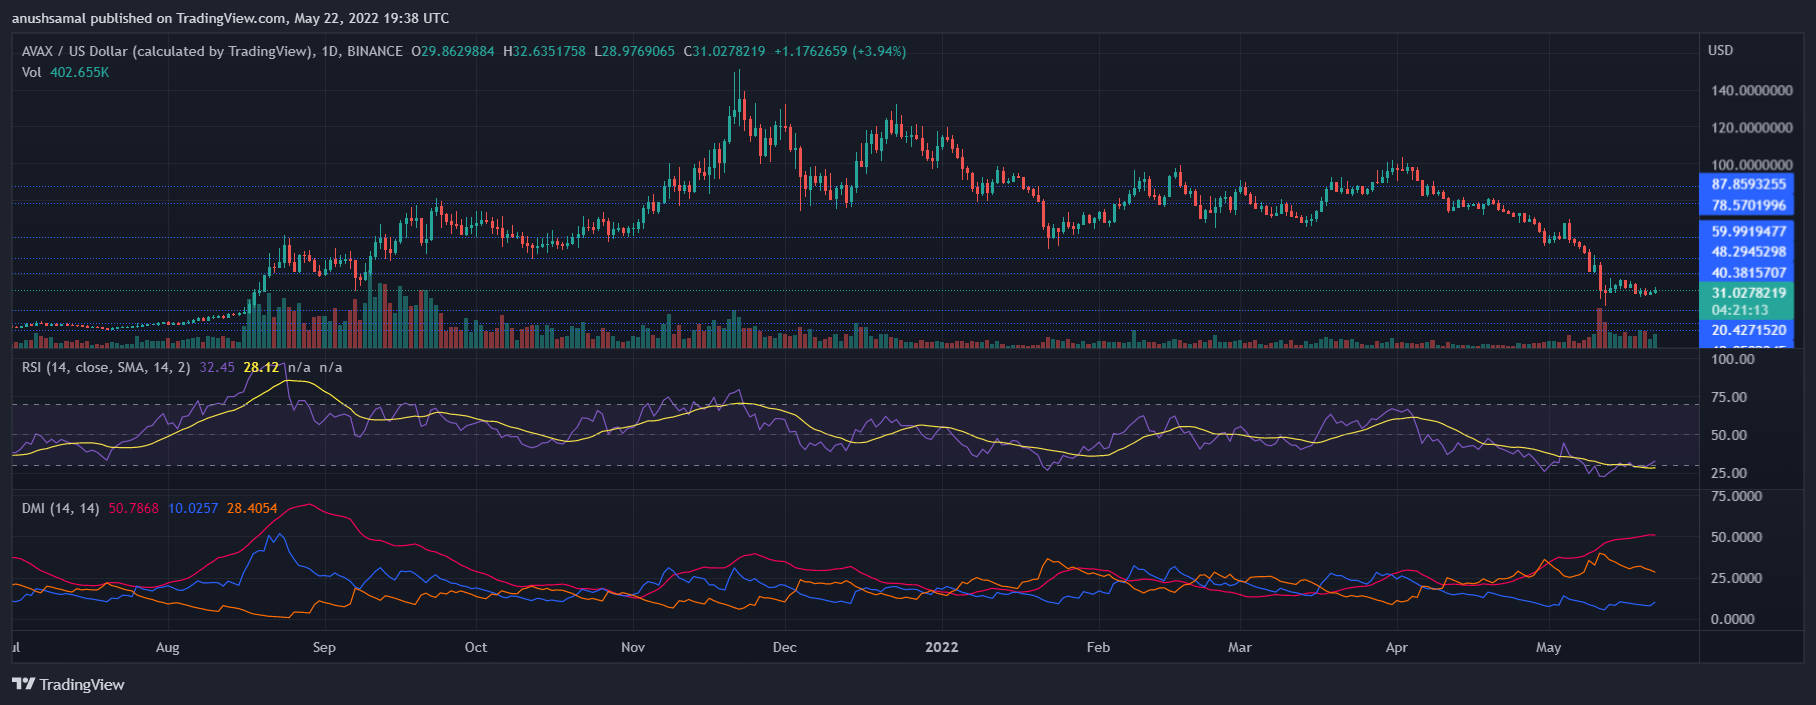
Avalanche (AVAX) was exchanging hands at $31 at the time of writing. The altcoin has been laterally trading at that price mark for nearly a week now. It revisited this price mark last year, however, back then the coin was on an uptrend.
Immediate resistance for the coin stood at $40 as established previously. A fall below the current price level could send AVAX near the $20 support mark. Failing to settle near the $20 mark could bring AVAX anywhere between the $12 and $9 support level.
Technical Analysis

The altcoin continues to depict weakness on its chart. The technical outlook seems bearish because buyers are nowhere to be seen in the market. As the coin revisited the August, last year’s price level, AVAX remained under the grasps of the sellers in the market.
According to the Relative Strength Index, the indicator was bordering the oversold mark. Until and unless, RSI manages to move above the half-line, it is too early to call this price action a reversal.
Going by the Directional Movement Index that reads the price direction, bears are in control. The -DI line was above the +DI mark signifying bearishness. The Average Directional Index line (red) was near the 50-mark, this reading meant that price action was strong with less signs of a reversal.
Suggested Reading | Avalanche Crumbles More Than 16% As Crypto Landslide Continues

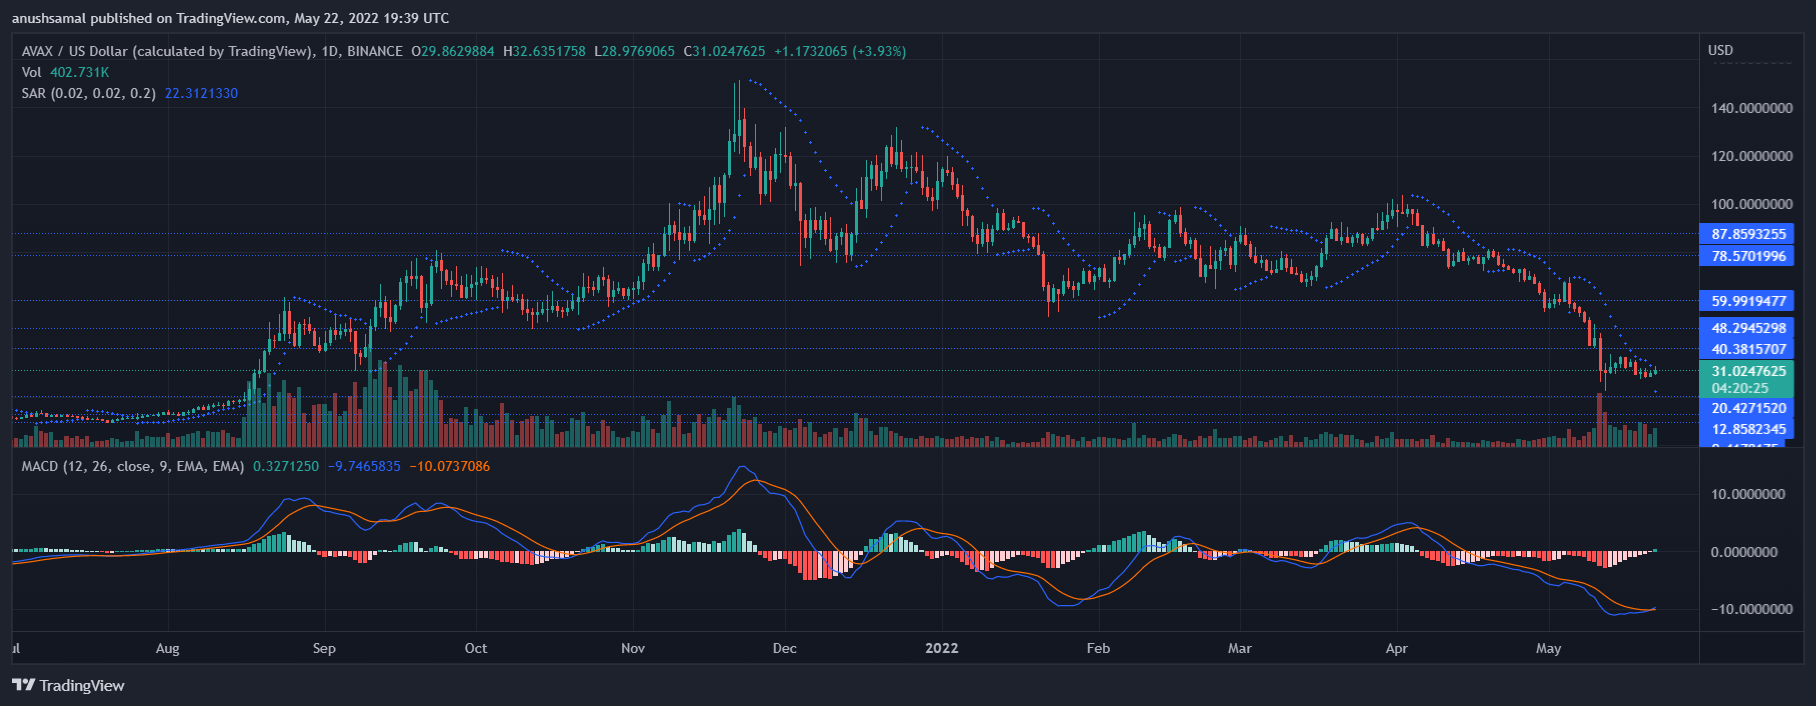
On the one day chart, AVAX’s technical pointed towards a possible change in price direction at the time of writing. Moving Average Convergence Diverge aka MACD, displayed a green signal bar above the half-line.
A green signal bar above the half-line might mean a buy signal, if continued buy signals are witnessed it may mean a change in price momentum.
Parabolic SAR also depicted a dot beneath the price candles, this means a change in price direction. If more dots are seen beneath the candlesticks over the upcoming trading sessions then AVAX might stage a recovery on its chart.
Suggested Reading | Cardano (ADA) Grapples At $0.524; Bullish Trajectory Coming


