
Key points:
-
The failure of the bulls to maintain Bitcoin above $94,050 has renewed selling, opening the doors for a fall to $87,700 and then to $84,000.
-
Most major altcoins remain under pressure and are threatening to challenge their recent lows.
Bitcoin (BTC) is stuck inside a narrow range between $94,588 and $89,260, indicating indecision between the bulls and the bears. The prediction markets do not expect the bulls to take charge in the near term, giving only a 30% chance of BTC hitting $100,000 before Jan. 1.
According to crypto analyst Darkfost, BTC is struggling to recover due to a lack of incoming liquidity, specifically from stablecoins. The crypto markets will have to attract new liquidity for BTC to start a “genuine bullish trend.”
Select analysts expect BTC to fall below the recent low of $80,600. Trader Roman said in a post on X that BTC is likely to drop to $76,000, and that falling interest rates will not be able to prevent it.
What are the crucial support and resistance levels to watch out for in BTC and major altcoins? Let’s analyze the charts of the top 10 cryptocurrencies to find out.
Bitcoin price prediction
BTC’s recovery is facing resistance at the 50% Fibonacci retracement level of $94,050, indicating that the bears are active at higher levels.
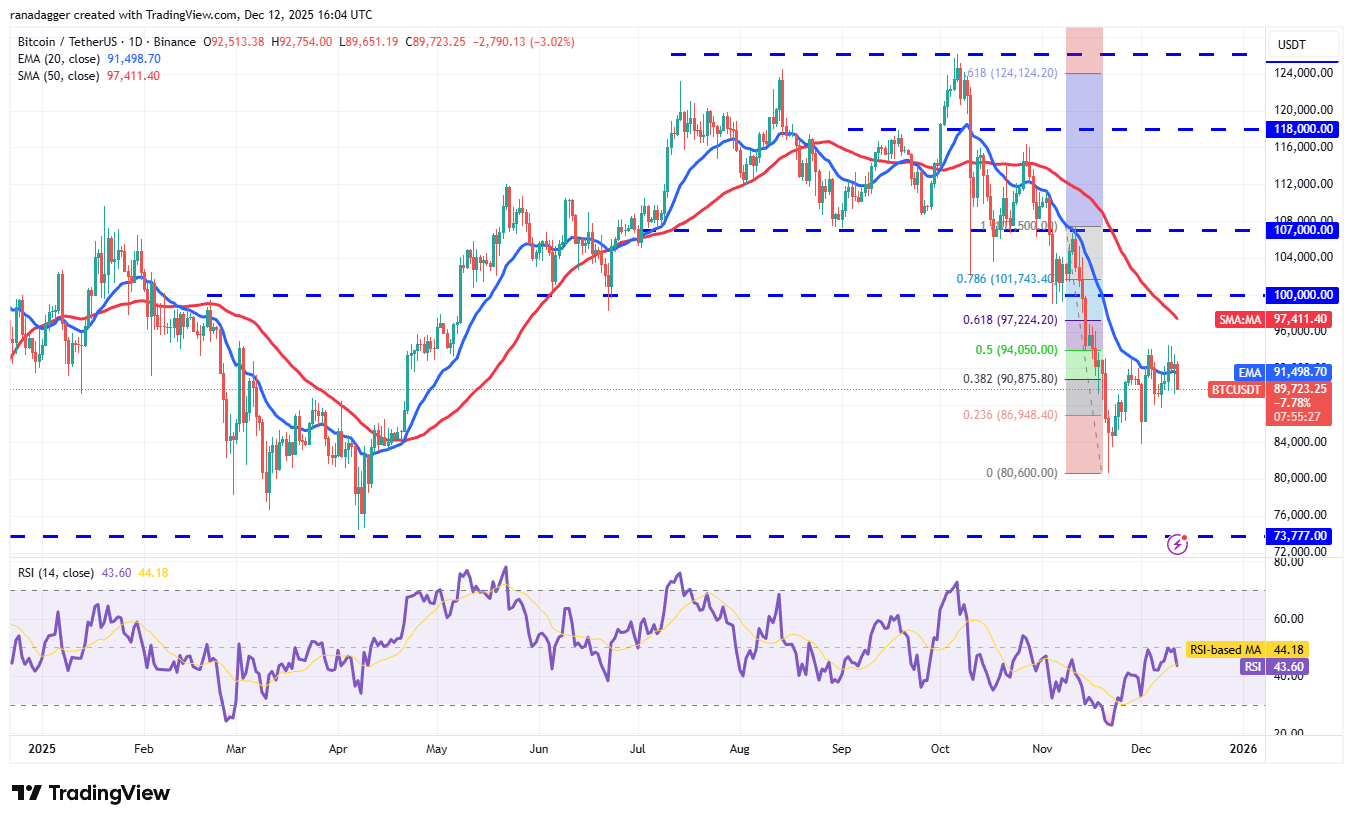
There is support at $87,700 and then at $84,000. A break below the $84,000 level opens the gates for a retest of the Nov. 21 low of $80,600.
Buyers will need to push the Bitcoin price above the $94,050 resistance level to signal strength. The BTC/USDT pair may then climb to the 50-day simple moving average ($97,411).
The up move is expected to face significant selling in the zone between the 50-day SMA and the psychological level of $100,000. A close above $100,000 indicates that the bulls are back in the game.
Ether price prediction
Ether (ETH) turned down from the $3,350 level on Thursday, and the bears are attempting to sustain the price below the 20-day exponential moving average ($3,125).
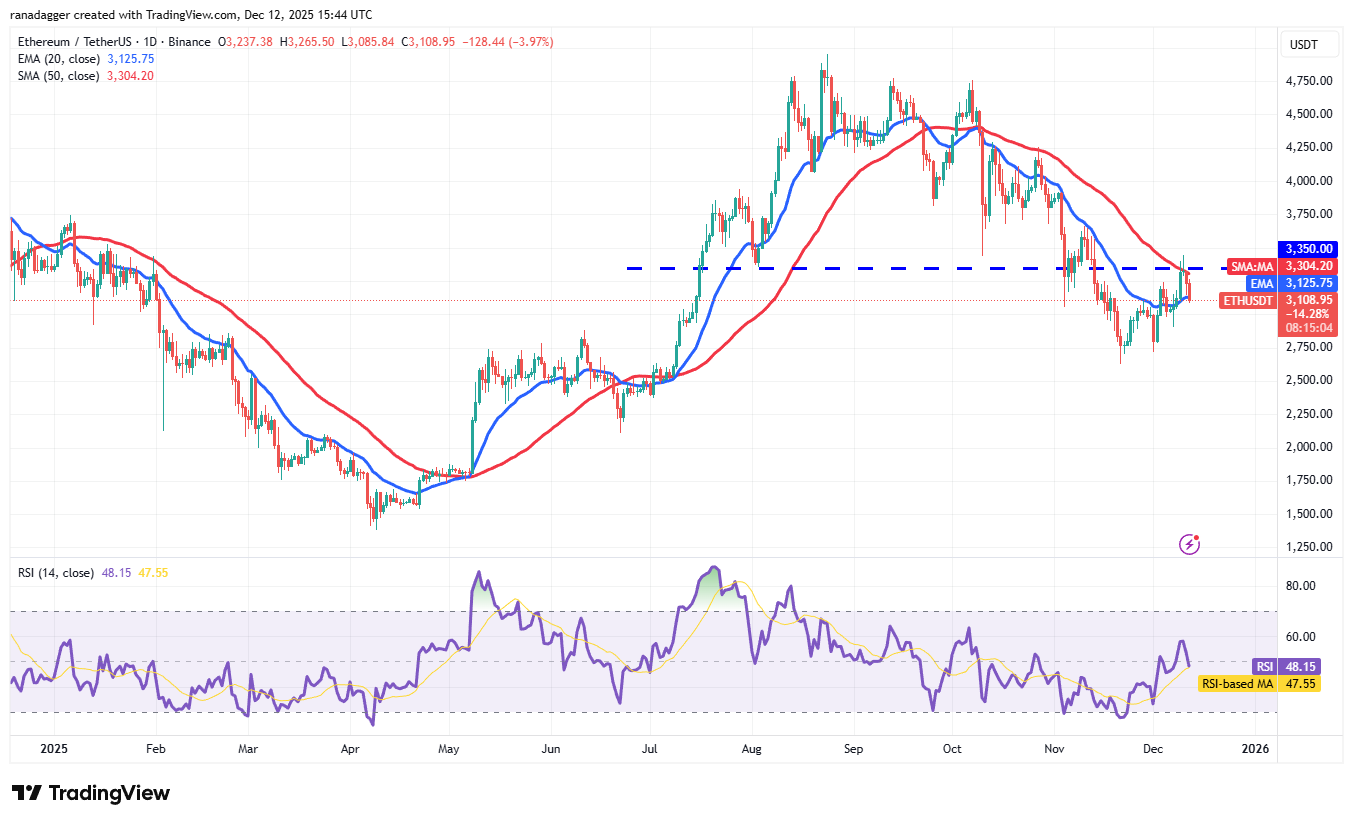
If they succeed, it indicates that the bears remain sellers on rallies. The Ether price may drop to $2,907 and later to $2,716. The ETH/USDT pair could resume its downtrend on a close below $2,623.
Conversely, if the price turns up from the current level and breaks above the $3,350 resistance, it signals the start of a new upward move. The pair may rise to $3,918 and then to $4,250.
BNB price prediction
BNB (BNB) has been trading near the 20-day EMA ($892) for the past few days, indicating equilibrium between buyers and sellers.
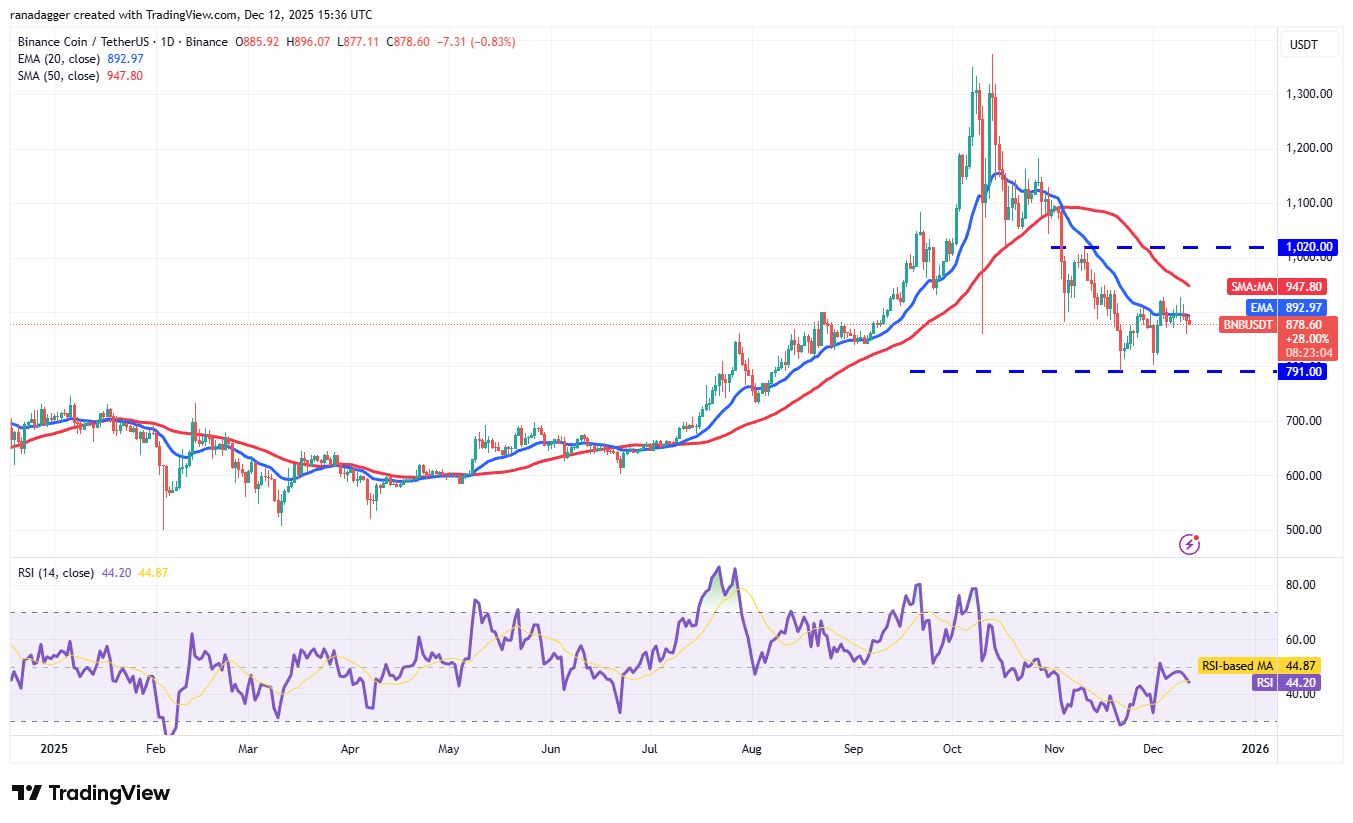
The flattish 20-day EMA and the RSI just below the midpoint suggest a range-bound action between $791 and $1,020 for the next few days.
Sellers will have to sink the BNB price below the $791 level to start the next leg of the downtrend. The BNB/USDT pair may then collapse to $730. On the upside, a close above $1,020 indicates that the correction may be over. The pair could then rally to $1,182, which may act as a resistance.
XRP price prediction
XRP (XRP) remains stuck inside the descending channel pattern, indicating that the bears are in control.
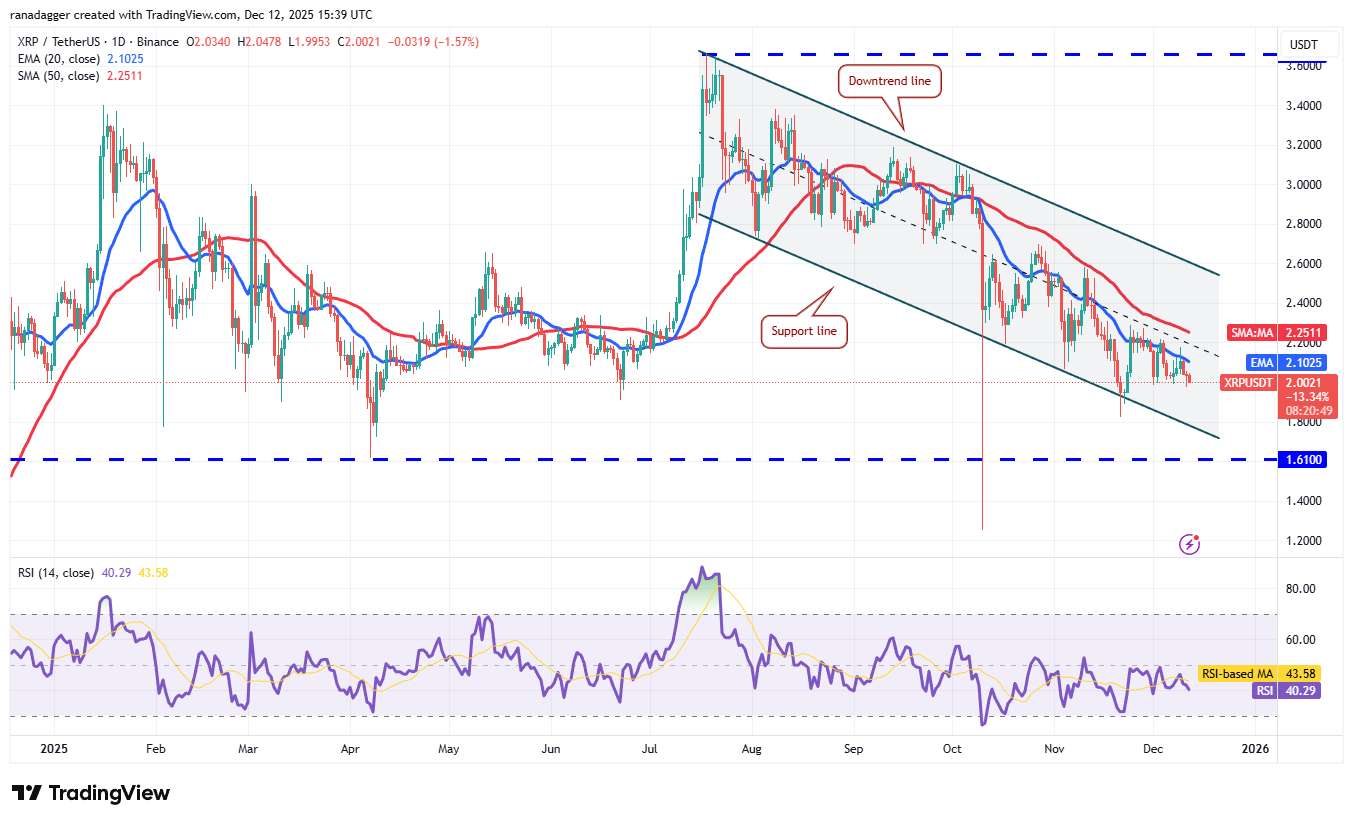
The bulls will have to propel the XRP price above the 50-day SMA ($2.25) to indicate strength. The XRP/USDT pair may then rally to the downtrend line, which is a vital level to watch out for. A close above the downtrend line signals that the bulls are back in the driver’s seat.
The bears will have to sink the price below the $1.98 level to clear the path for a drop to the support line and then to the critical level at $1.61.
Solana price prediction
The long tail on Solana’s (SOL) Thursday candlestick shows that the bulls are aggressively defending the $126 level.
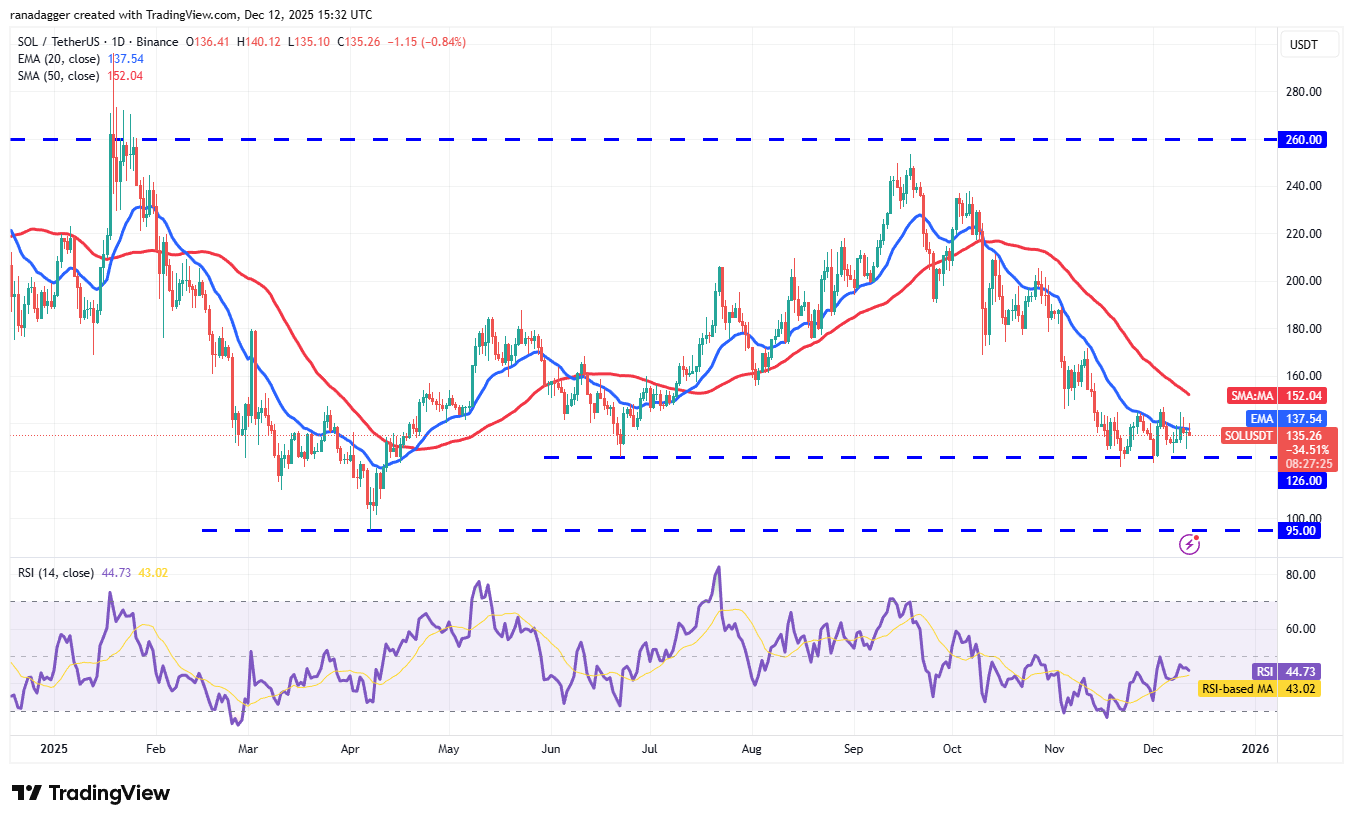
The bulls will have to propel the Solana price above the 50-day SMA ($152) to signal a potential trend change in the near term. The SOL/USDT pair could then ascend to $172 and subsequently to $190.
On the other hand, a break and close below the $126 level signals the resumption of the downward move. The pair may plummet to $100 and, after that, to the strong support at $95.
Dogecoin price prediction
Dogecoin (DOGE) turned down from the 20-day EMA ($0.14) on Wednesday, indicating that the bears are selling on every minor rally.
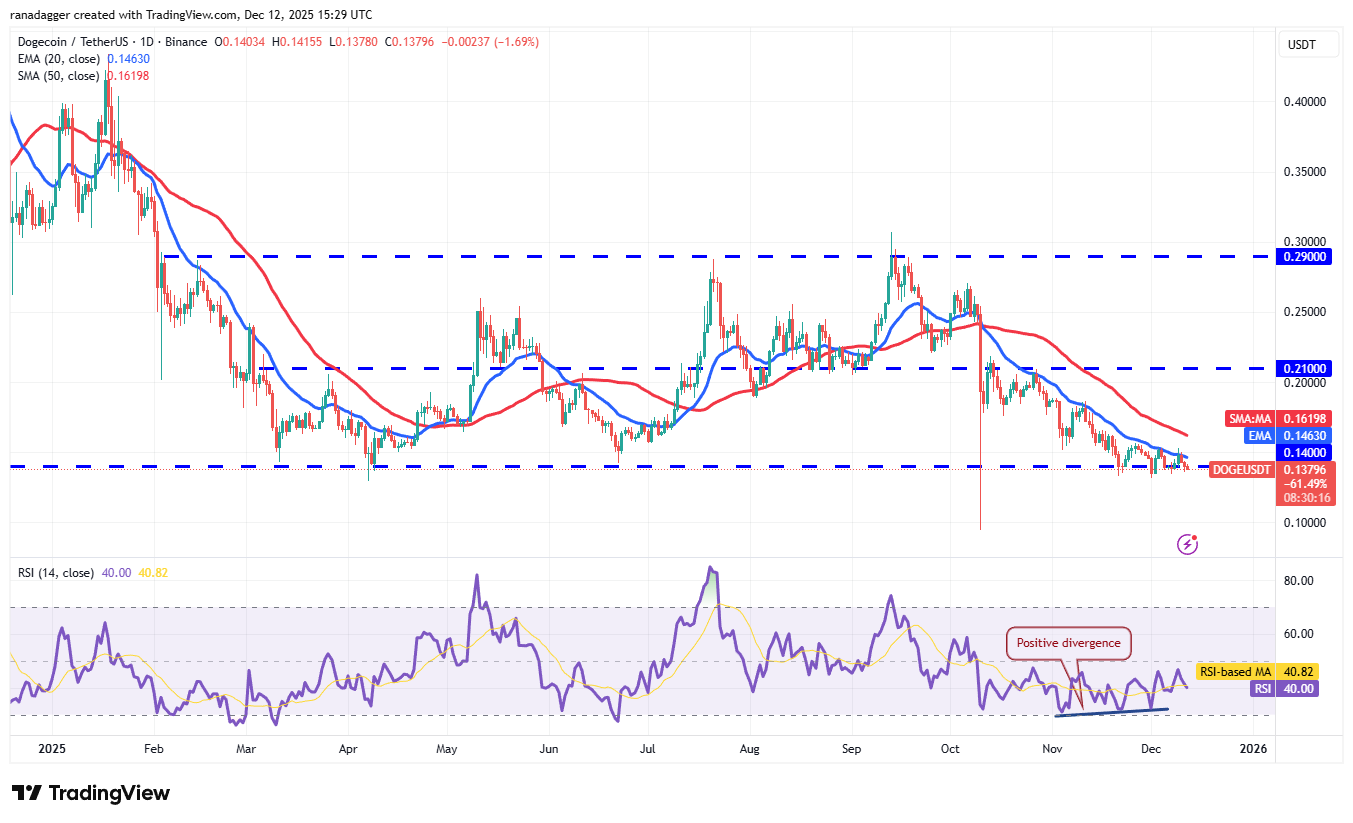
If the price continues lower and closes below the $0.13 support, it signals the start of a new downward move. The DOGE/USDT pair could then plunge to the Oct. 10 low of $0.10, which is likely to attract buyers.
The first sign of strength will be a break and close above the 20-day EMA. That shows the bulls are fiercely defending the $0.14 level. The Dogecoin price may climb to the 50-day SMA ($0.16) and later to $0.19.
Cardano price prediction
Cardano (ADA) turned down from the breakdown level of $0.50 on Wednesday, indicating that the bears are trying to flip the level into resistance.
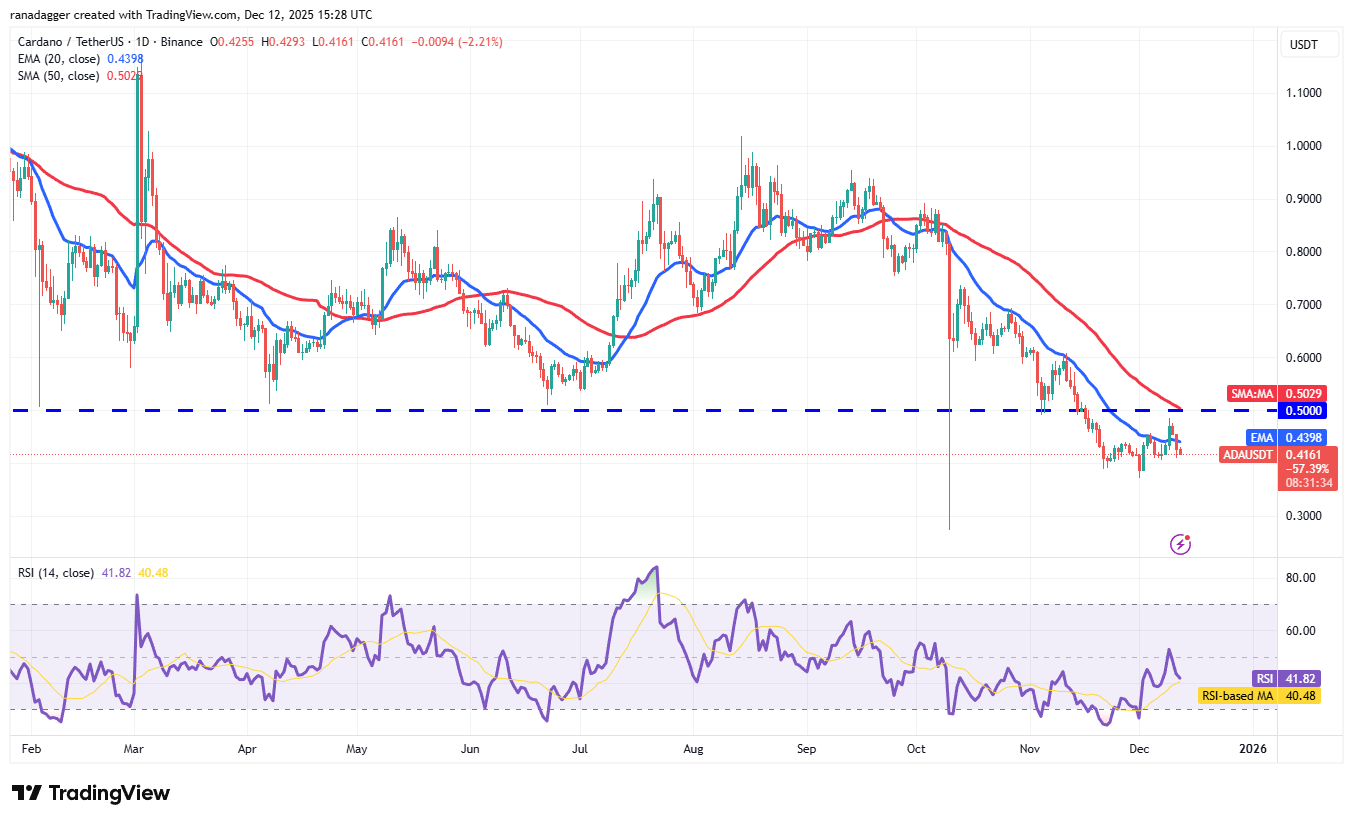
The flattish 20-day EMA ($0.44) and the RSI in the negative territory indicate a slight edge to the bears. There is support at $0.40 and then at $0.37. If sellers pull the Cardano price below $0.37, the ADA/USDT pair could tumble to $0.31 and potentially to the Oct. 10 intraday low of $0.27.
Buyers will have to push and maintain the price above the $0.50 level to signal a comeback. The pair could then rally to $0.60 and later to $0.70.
Related: Ether price rallied 260% last time this happened: Can ETH reach $5K?
Bitcoin Cash price prediction
Bitcoin Cash (BCH) turned up from the 20-day EMA ($560) on Thursday, indicating a positive sentiment.
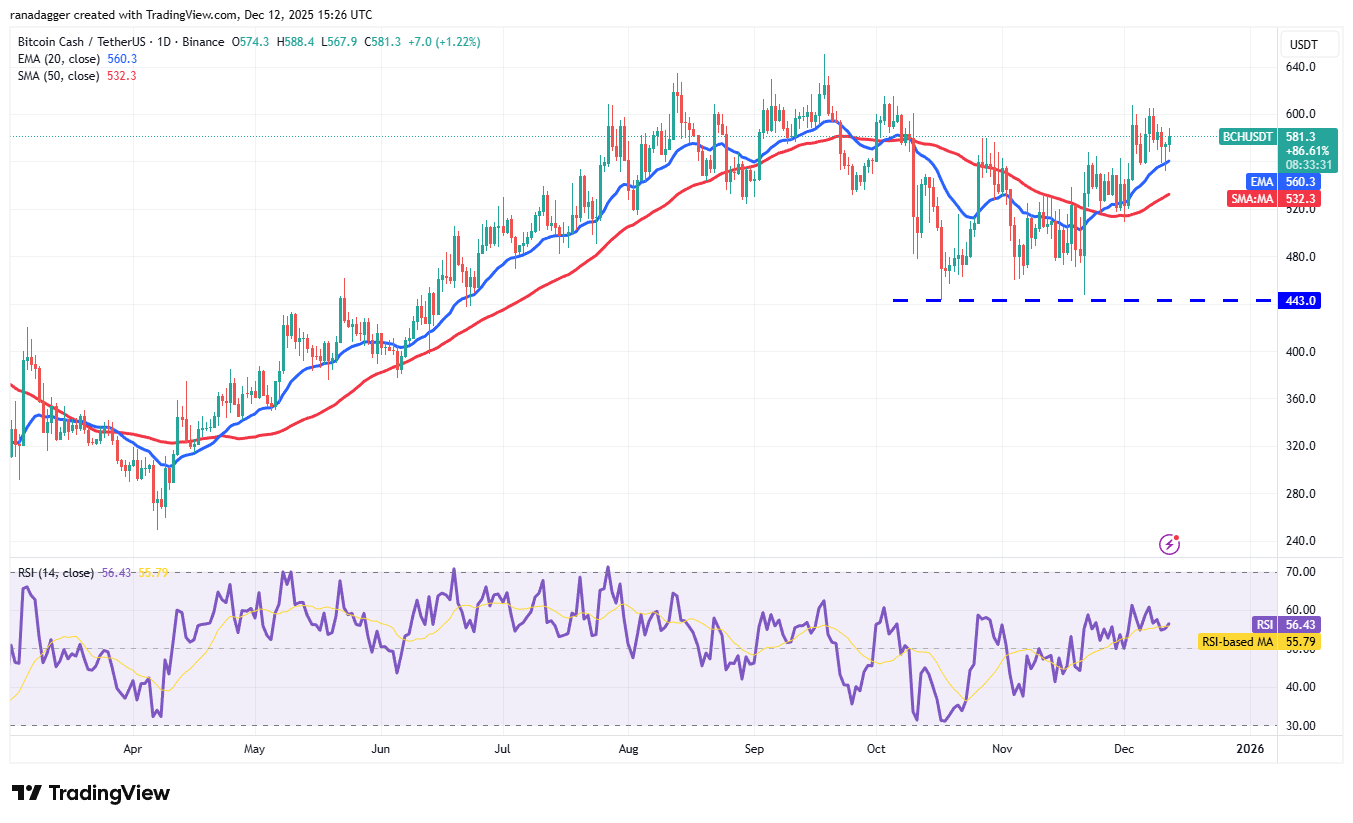
The bulls will strive to drive the Bitcoin Cash price above the $607 level and challenge the overhead resistance at $651. Sellers are expected to defend the $651 level with all their might, as a break above it opens the doors for a rally to $720.
The bears will have to sink the price below the moving averages to gain the upper hand. If they manage to do that, it suggests that the BCH/USDT pair could range between $607 and $443 for some time.
Hyperliquid price prediction
Sellers attempted to pull Hyperliquid (HYPE) lower on Thursday, but the long tail on the candlestick shows buying by the bulls.
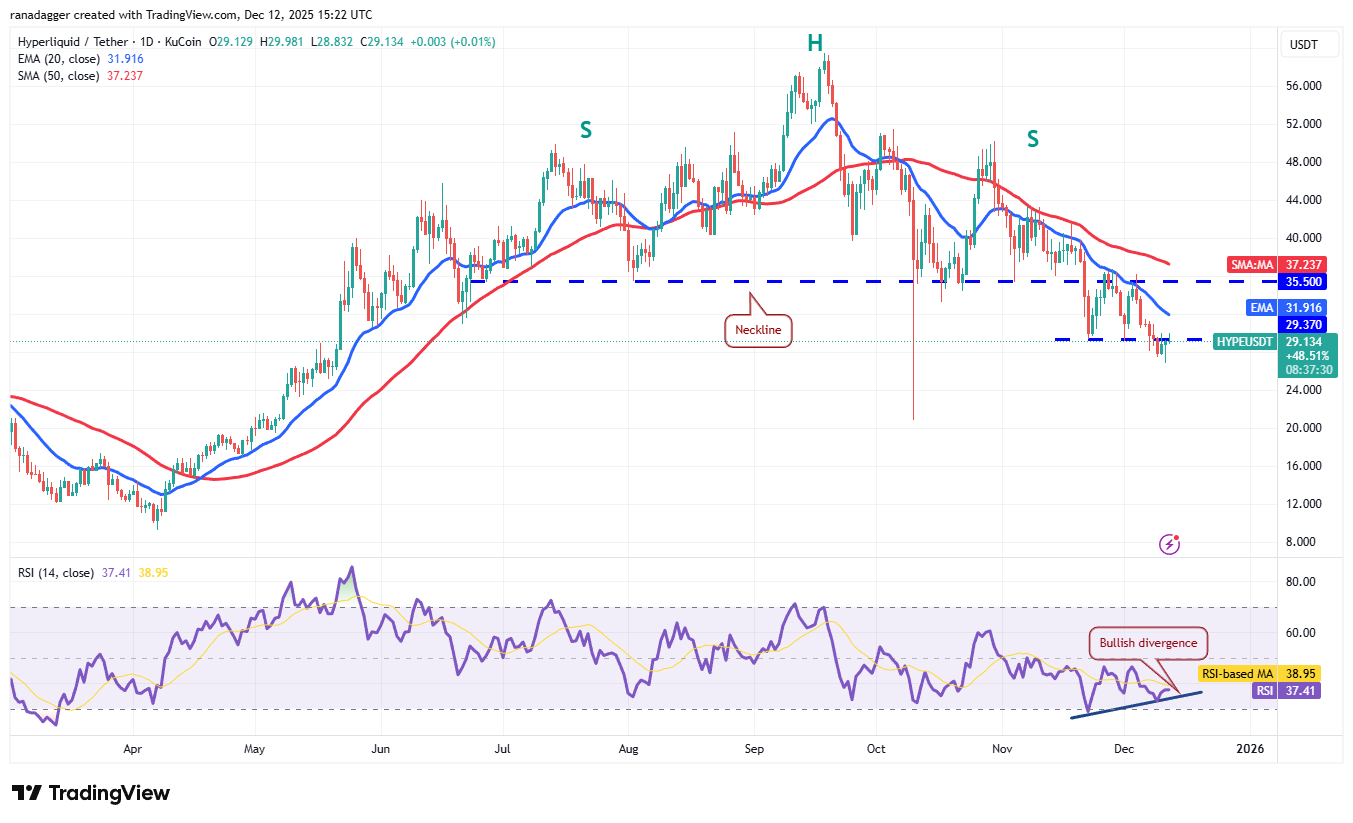
The HYPE/USDT pair could reach the 20-day EMA ($31.91), which is a critical level to watch out for. If the price turns down sharply from the 20-day EMA, the bears will again attempt to resume the downtrend.
On the contrary, a break above the 20-day EMA signals that the selling pressure is reducing. The Hyperliquid price could then rise to the 50-day SMA ($37.23). A close above the 50-day SMA suggests the corrective phase may be over.
Chainlink price prediction
Chainlink (LINK) has been trading between the moving averages for the past few days, indicating a balance between supply and demand.
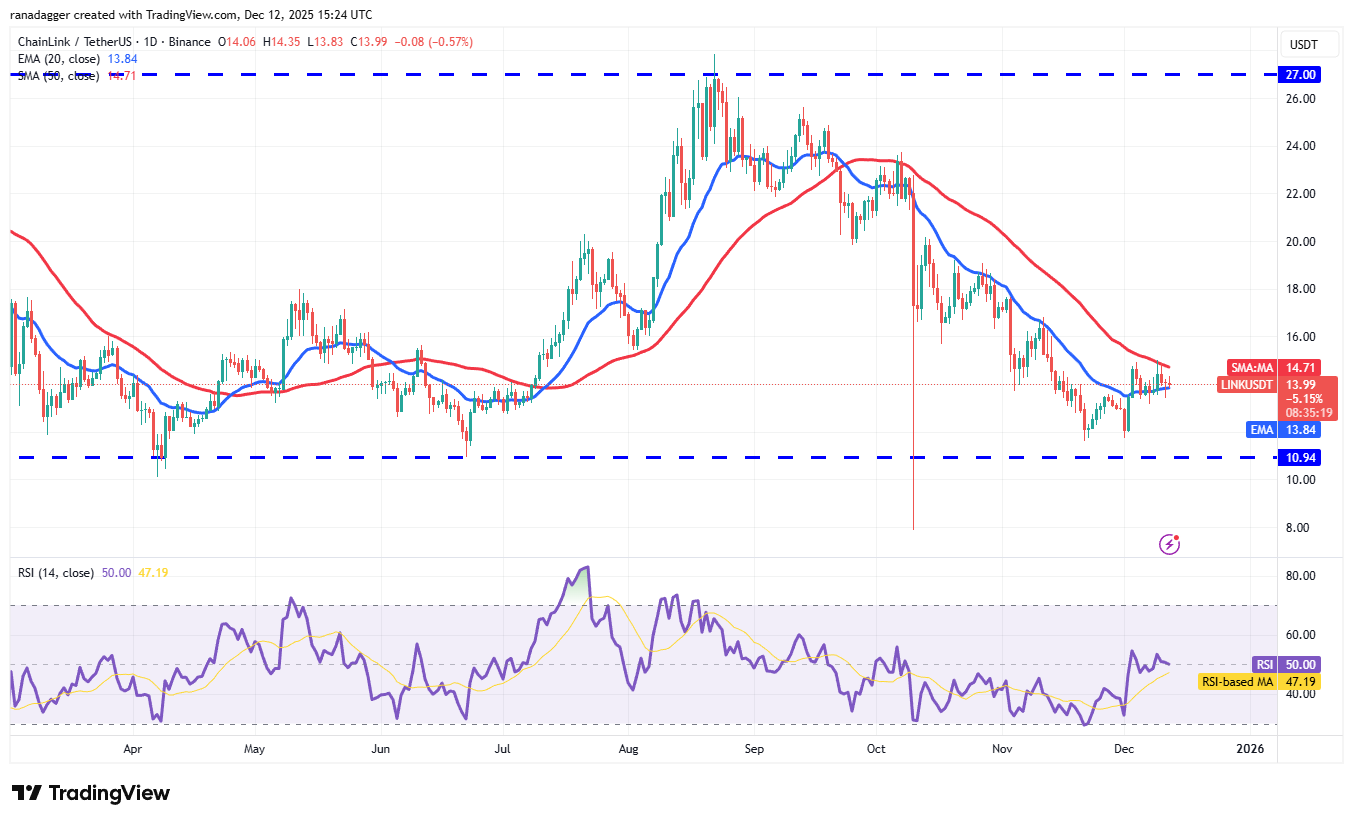
The tight range trading is likely to be followed by a range expansion. If the price breaks and closes above the 50-day SMA ($14.71), it signals that the bulls have overpowered the bears. The LINK/USDT pair could then climb to $19.06.
Alternatively, a sharp dip below the 20-day EMA ($13.84) indicates that the bears remain in control. The Chainlink price could then plummet to the solid support at $10.94, where the buyers are expected to step in.
This article does not contain investment advice or recommendations. Every investment and trading move involves risk, and readers should conduct their own research when making a decision. While we strive to provide accurate and timely information, Cointelegraph does not guarantee the accuracy, completeness, or reliability of any information in this article. This article may contain forward-looking statements that are subject to risks and uncertainties. Cointelegraph will not be liable for any loss or damage arising from your reliance on this information.


