Bitcoin (BTC) drifted toward $27,000 after the Aug. 30 Wall Street open as the dust settled on digital asset manager Grayscale’s legal victory.
BTC buyer interest remains low
Data from Cointelegraph Markets Pro and TradingView showed BTC price cooling volatility, which began the day prior, when a positive verdict for Grayscale against United States regulators sparked 7.5% gains.
Bitcoin managed $28,143 on Bitstamp — its highest in almost two weeks — before returning to consolidate lower.
Despite closing the daily candle above two key moving averages, these had yet to return as definitive intraday support, and on the day, analysts were cautious.
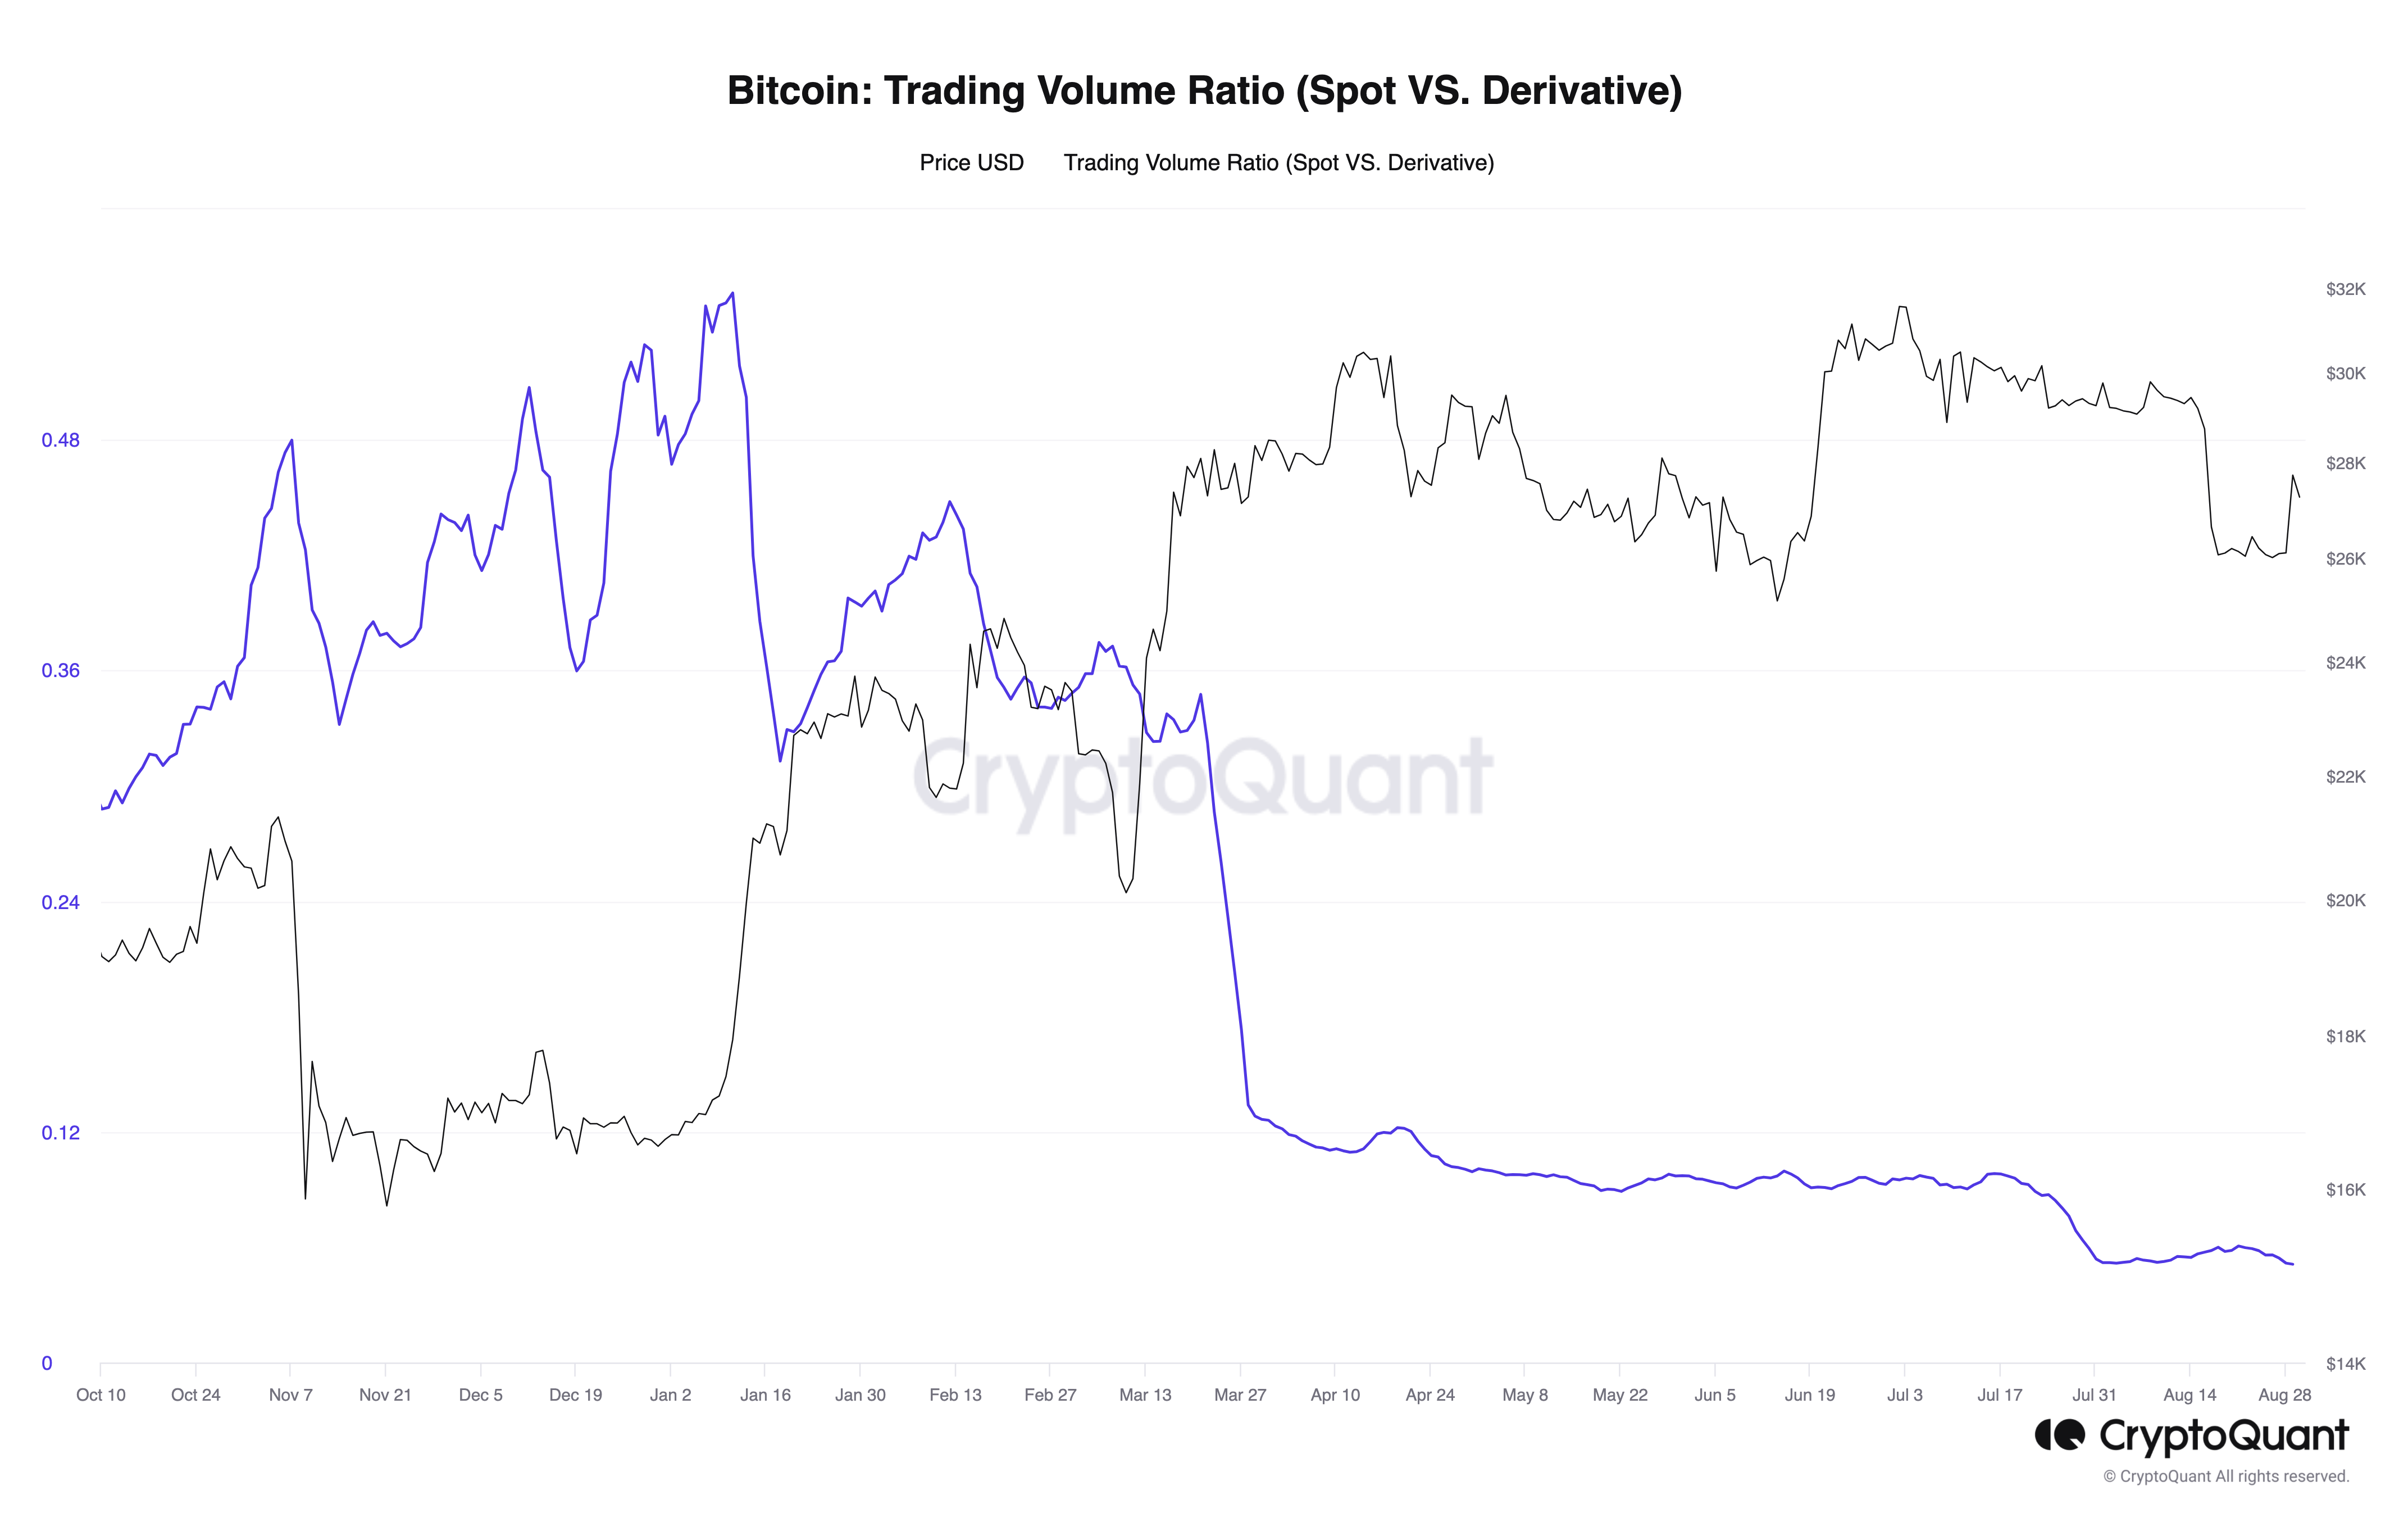
In a Quicktake post for on-chain analytics platform CryptoQuant, contributor “MAC_D” was among those noting that the Grayscale move had originated on derivatives exchanges.
Despite funding rates remaining fairly neutral, there was a clear absence of genuine buyer interest on spot markets.
“First, looking at the ‘Funding Rate’, it is not an extreme value, so it is not expected to cause a sharp price correction,” he wrote.
“However, it is difficult to see that the spot exchange led the price increase when the BTC price rose yesterday. The reason is that the ‘Trading Volume Ratio (Spot VS. Derivative)’ shows that it has decreased rather than increased.”
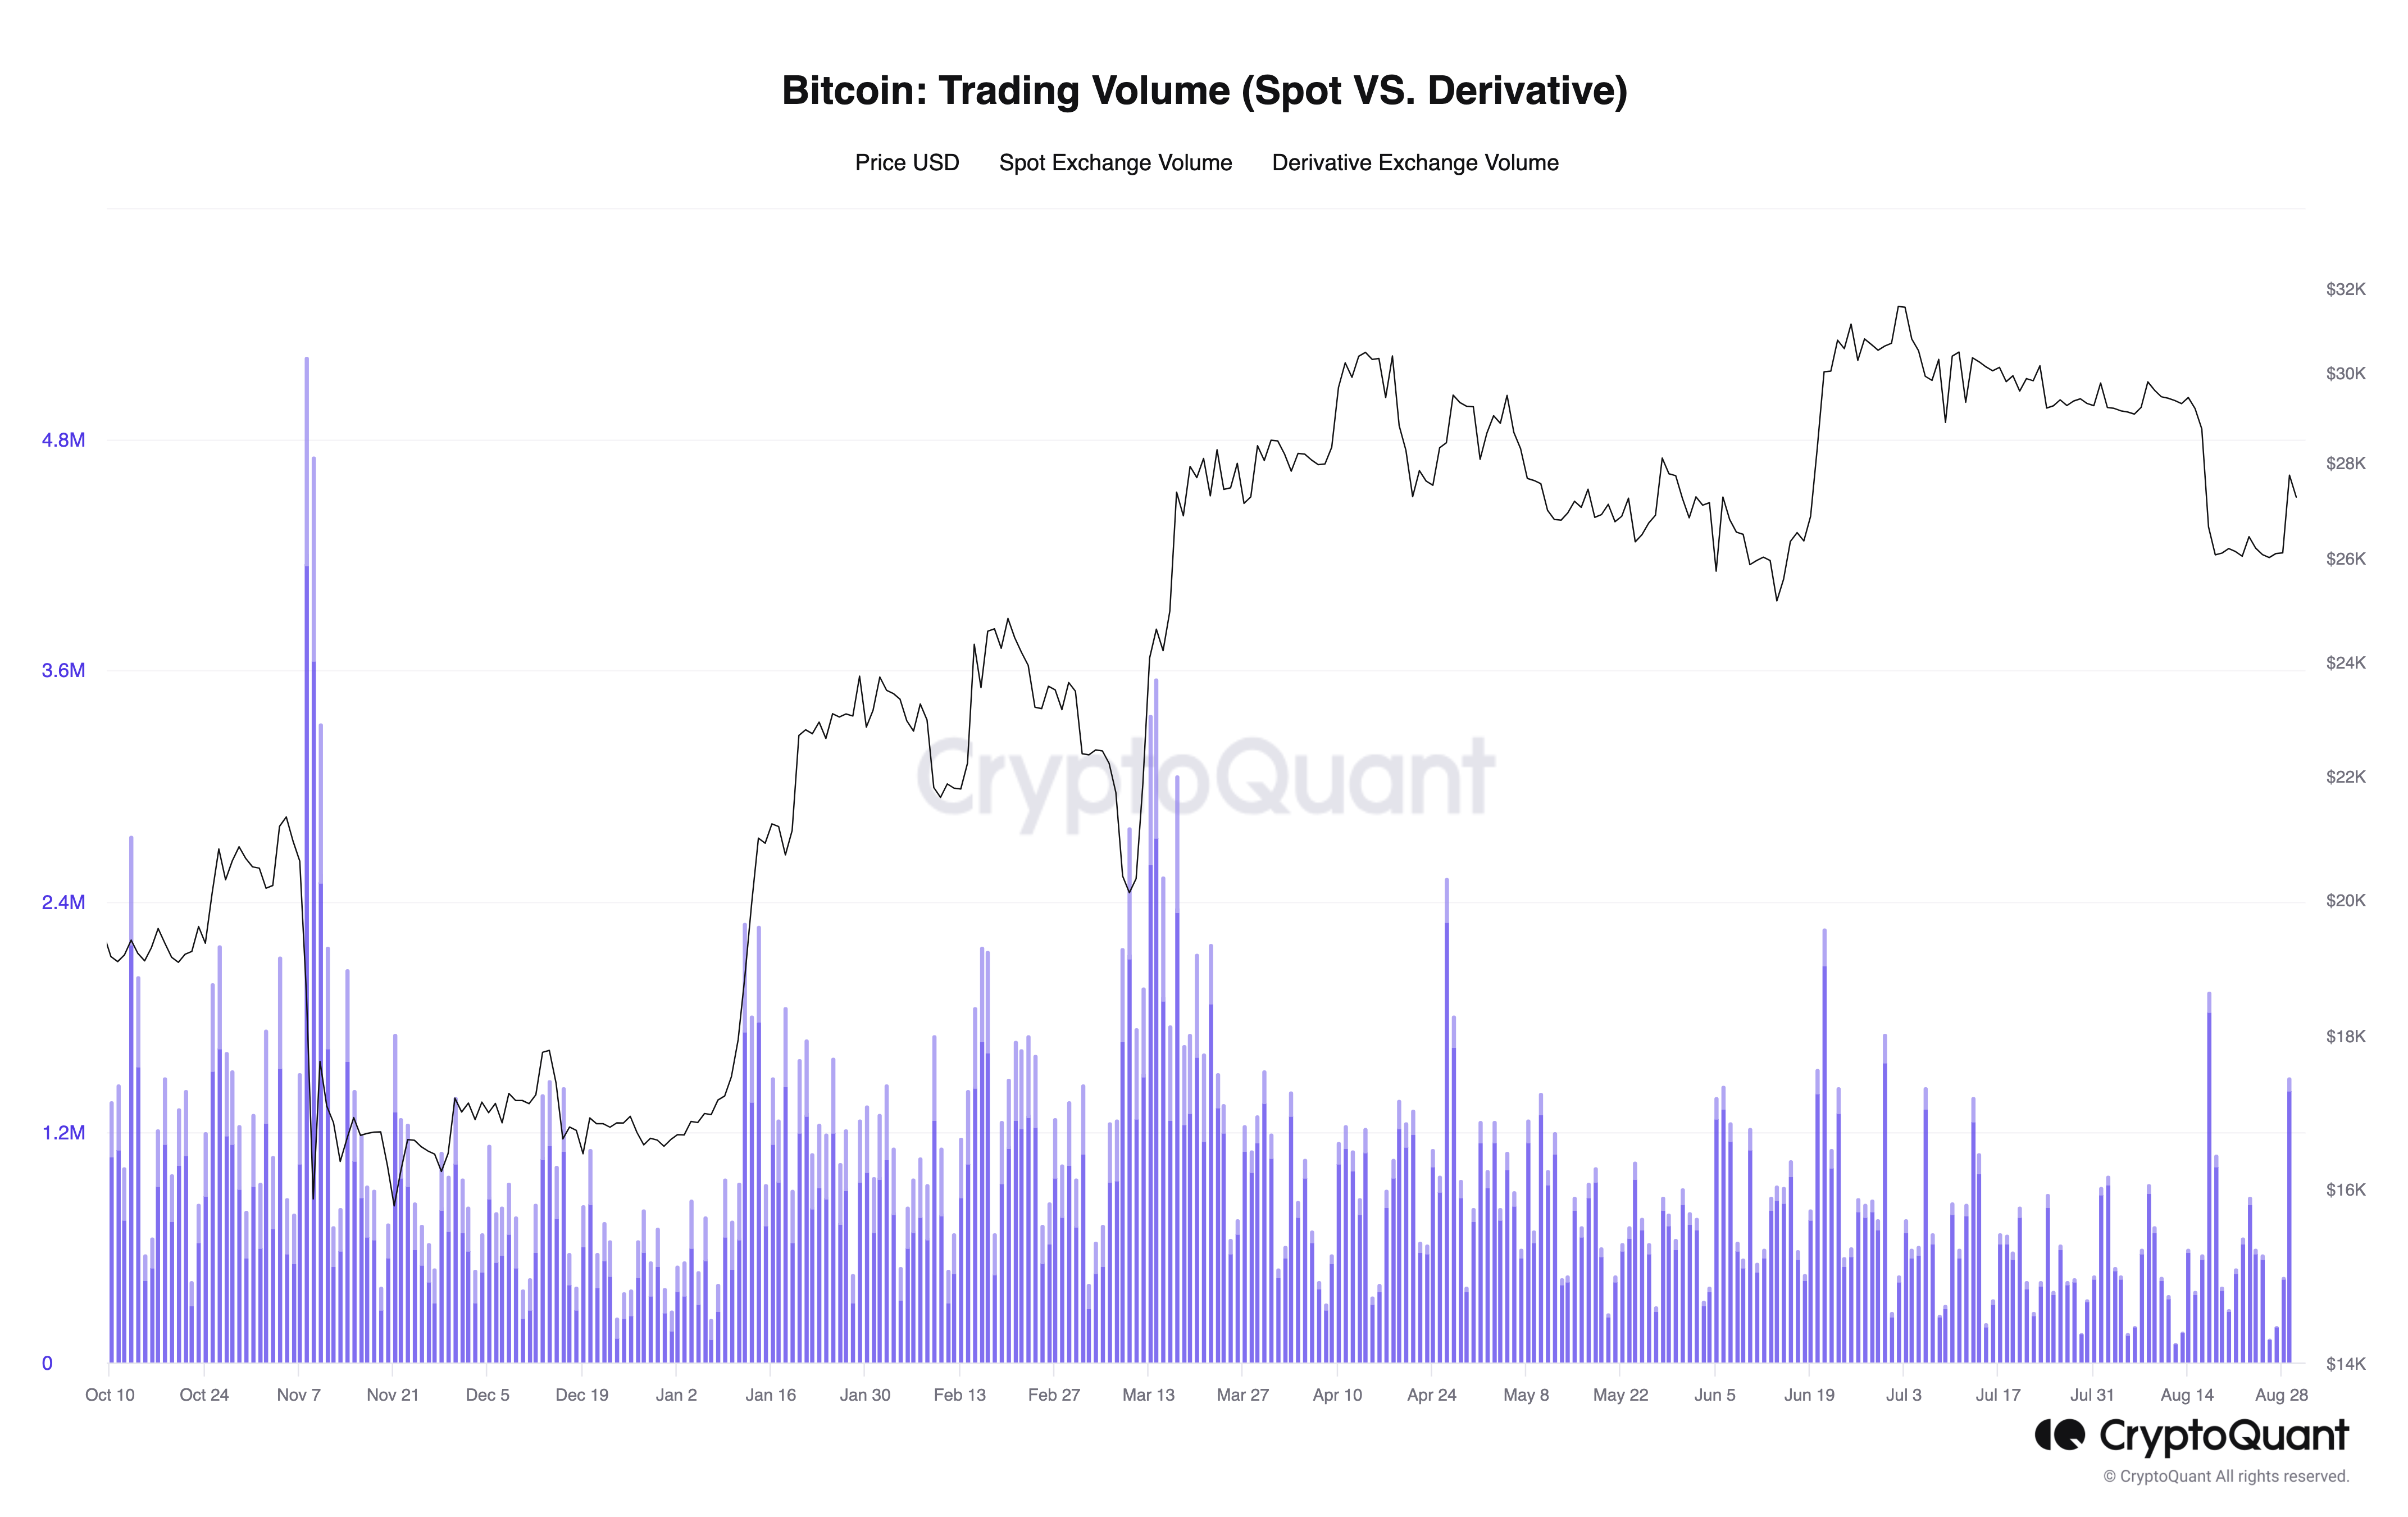
Additional data showed trading volumes were still below those seen during upticks earlier in 2023.
“Of course, there is a tendency for prices to change significantly even with small trading volumes because the overall liquidity in the cryptocurrency market has decreased,” MAC_D continued.
“However, it seems that there is a need to be a little cautious about the fact that this rally leads to a dramatic rally.”
“Many similarities” to Bitcoin’s all-time high
Equally conservative on the long-term outlook was popular trader and analyst Rekt Capital.
Related: GBTC Bitcoin ‘discount’ may be gone by 2024 as share price gains 17%
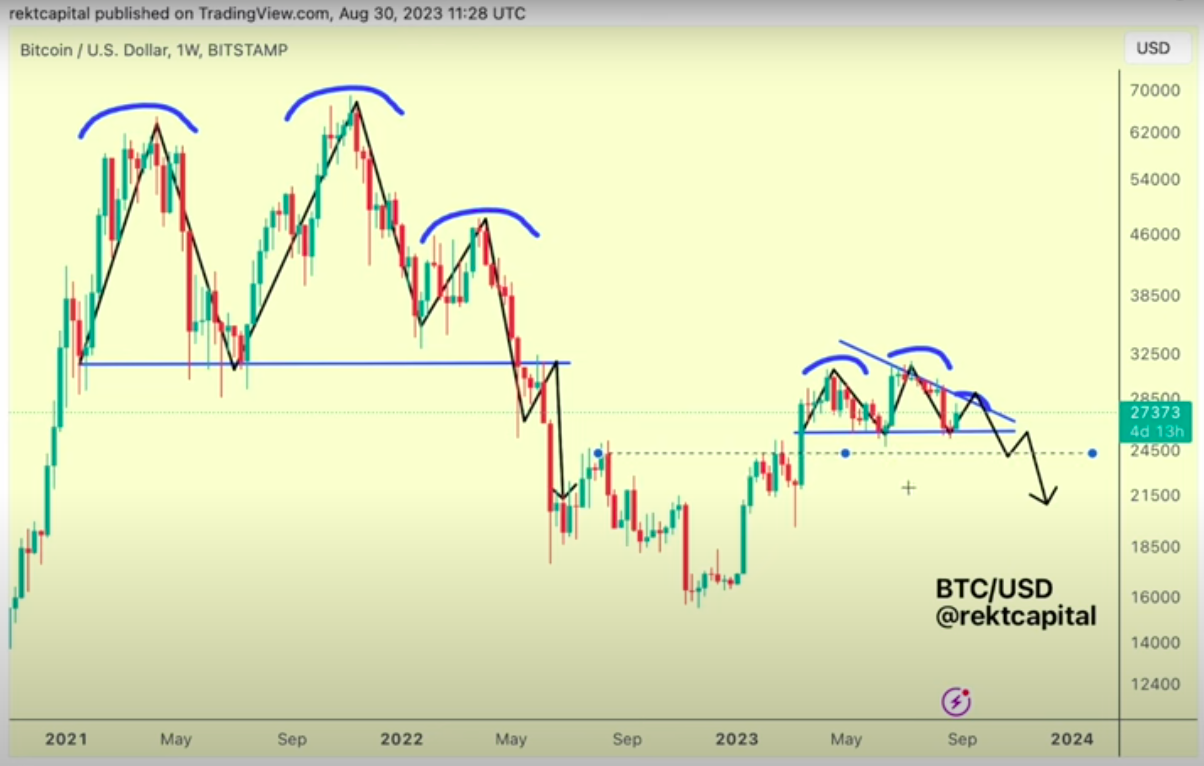
In his latest YouTube update, Rekt Capital suggested that BTC/USD might be printing a copycat move similar to that seen in 2021 around its current all-time high.
While no new BTC price peak is expected now, the recent tops around $31,000 on the weekly chart and subsequent breakdown are reminiscent of Bitcoin’s performance going into the 2022 bear market.
“We’re seeing many similarities between the double top of 2021 and what we’re seeing right now,” he warned.
Should the similarities play out and BTC/USD produce a full fractal, $26,000 would flip from support to resistance to initiate further downside.
“For the time being, we are seeing a lot of signs really playing into all of this,” Rekt Capital reiterated.
Earlier, Cointelegraph reported on prospective targets for a BTC price bottom, with $23,000 becoming increasingly important.
Rekt Capital likewise flagged $23,000 as a prominent level versus the 2022 bear market bottoming structure — an inverse head and shoulders pattern.
“That’s the level that we could see price rebound from,” he added.
This article does not contain investment advice or recommendations. Every investment and trading move involves risk, and readers should conduct their own research when making a decision.


