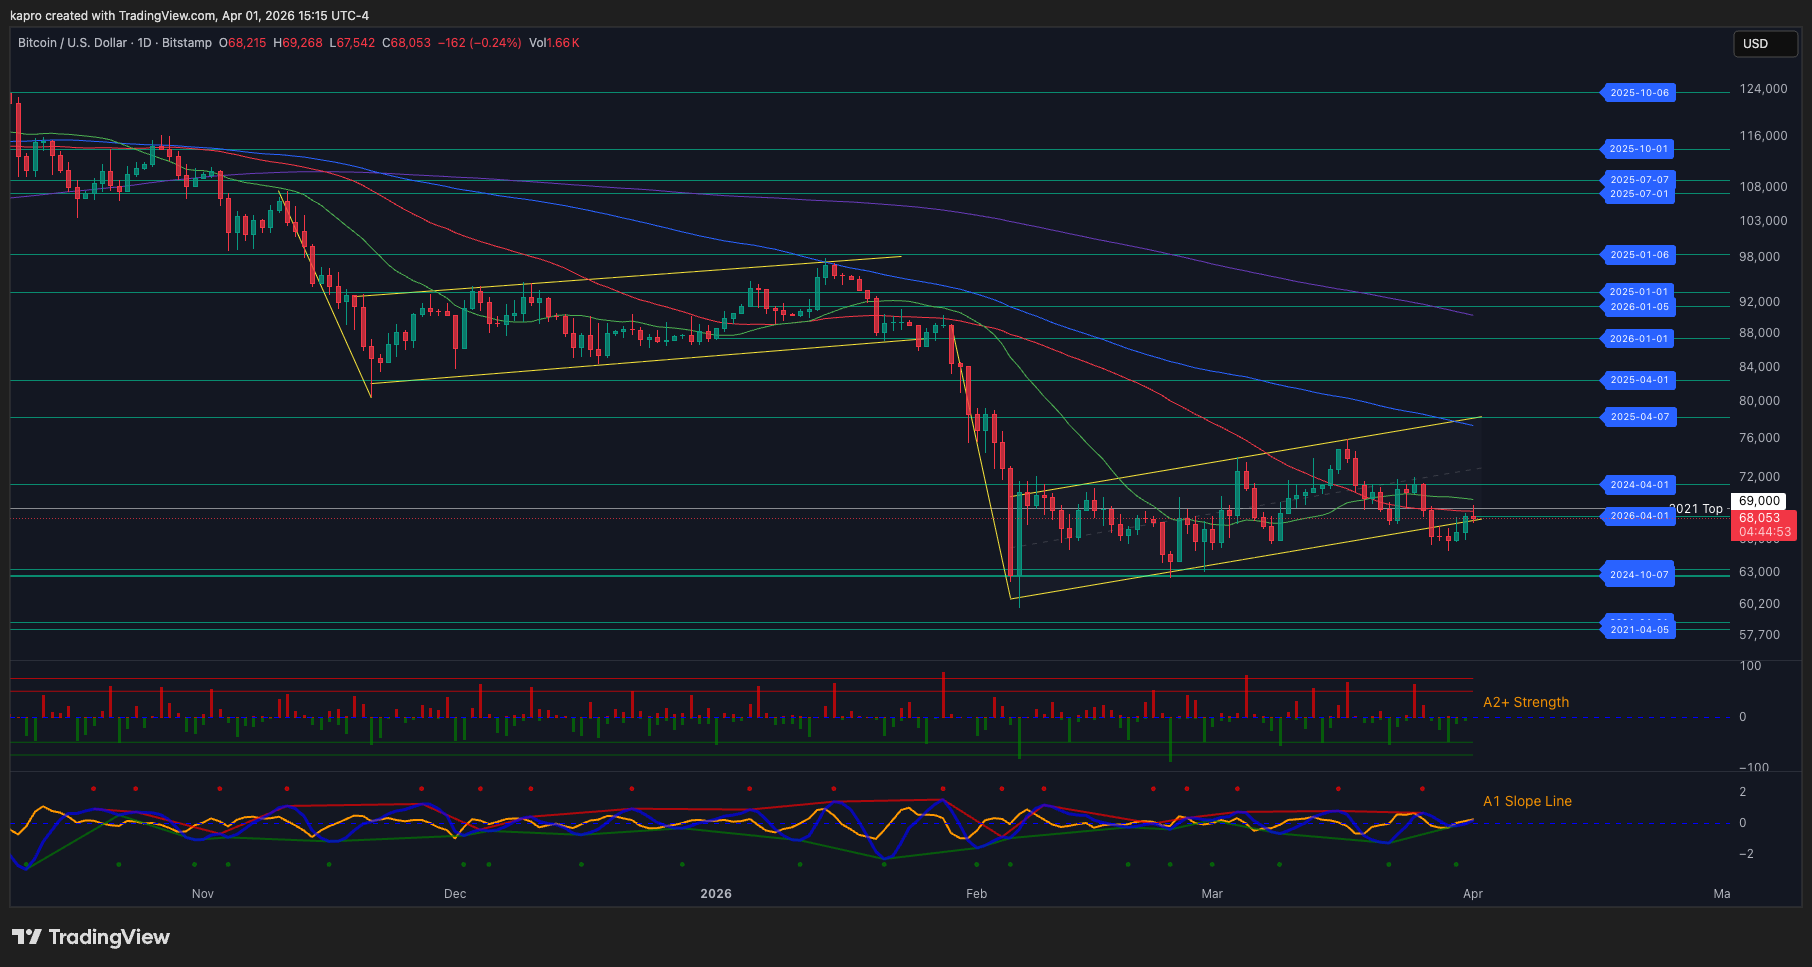
Bitcoin (BTC) saw another $69,000 rejection on Thursday as risk-assets suffered over US-Iran war headlines.
Key points:
-
Bitcoin faces fresh downside pressure as stocks and gold fall on US President Donald Trump’s address to the nation.
-
US dollar strength ramps up on the back of an anticipated breakout to yearly highs.
-
Bitcoin would face “new lows” from a dollar comeback, a trader warns.
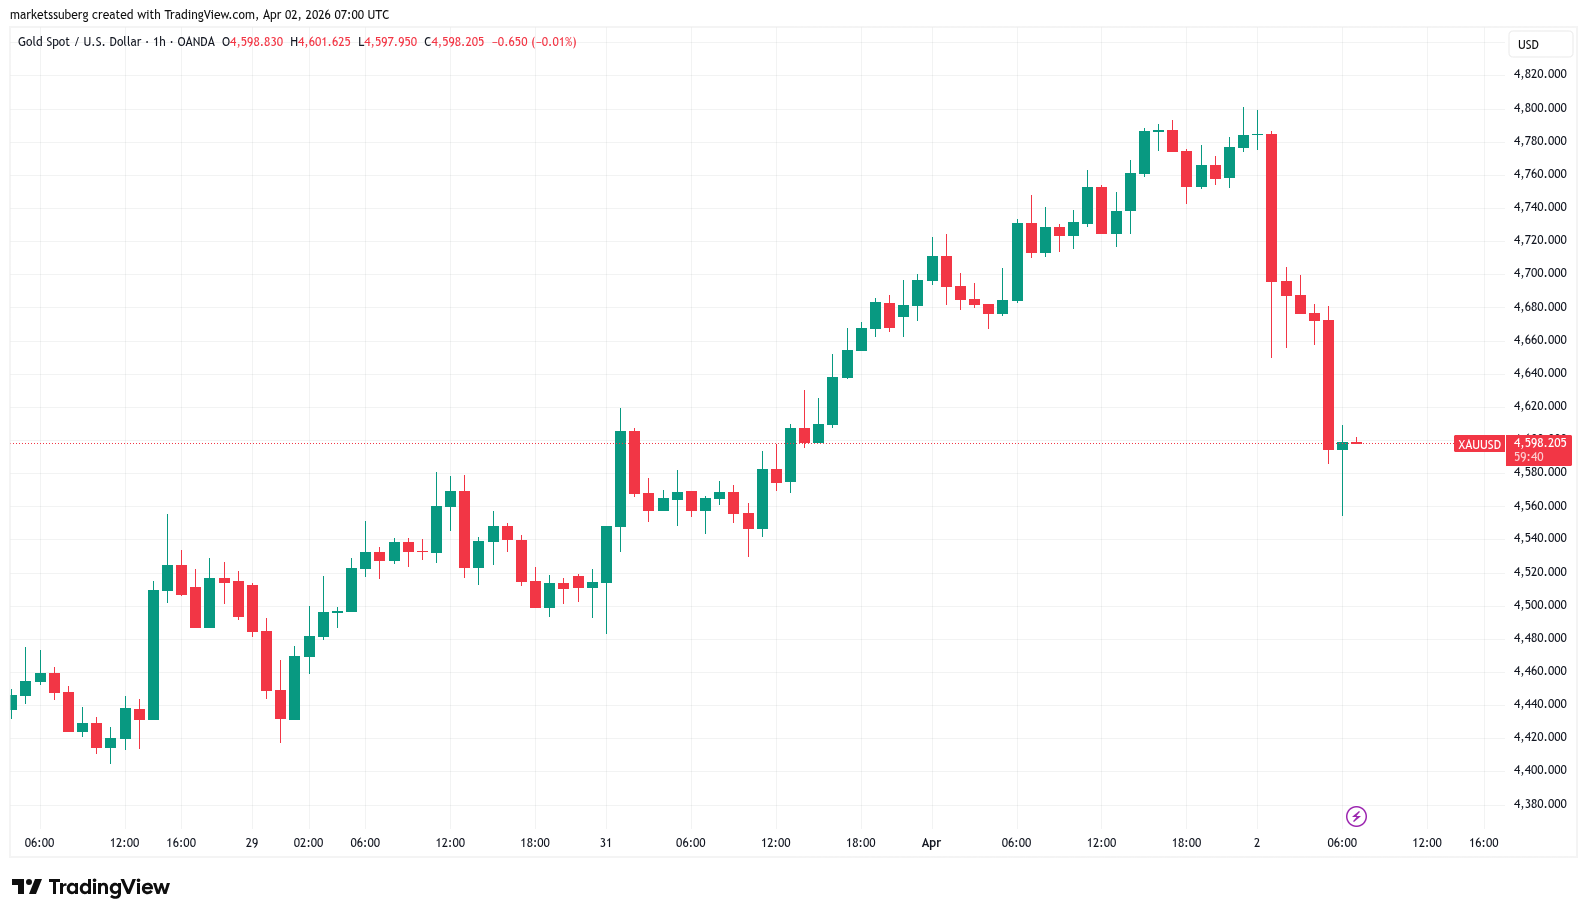
Bitcoin, stocks and gold all fall on Trump address
Data from TradingView showed 2% daily BTC price losses with lows near $66,200.
Crypto had joined stocks and gold in falling on the back of an address to the nation by US President Donald Trump. While markets anticipated deescalation, Trump’s tone left the door open for further escalation of the conflict.
“Between threatening Iran’s power plants, saying the Iran War would last 2-3 more weeks, and calling out NATO, there was nothing new,” trading resource The Kobeissi Letter wrote in a reaction on X.
“Yet, the market is now trading like the Iran War is ramping up for another month-long escalation. Why? Because he didn’t explicitly de-escalate.”
Kobeissi called the address “incredibly puzzling,” suggesting that it would fuel and not calm market nerves.
“The market, which was finally beginning to show some signs of calming, is now highly agitated, with US oil prices back to $104/barrel, stocks down sharply, and the bond market melting down again,” it added.
“Ironically, President Trump is now back to solving the problem he fixed earlier this week: How will he contain the market?”
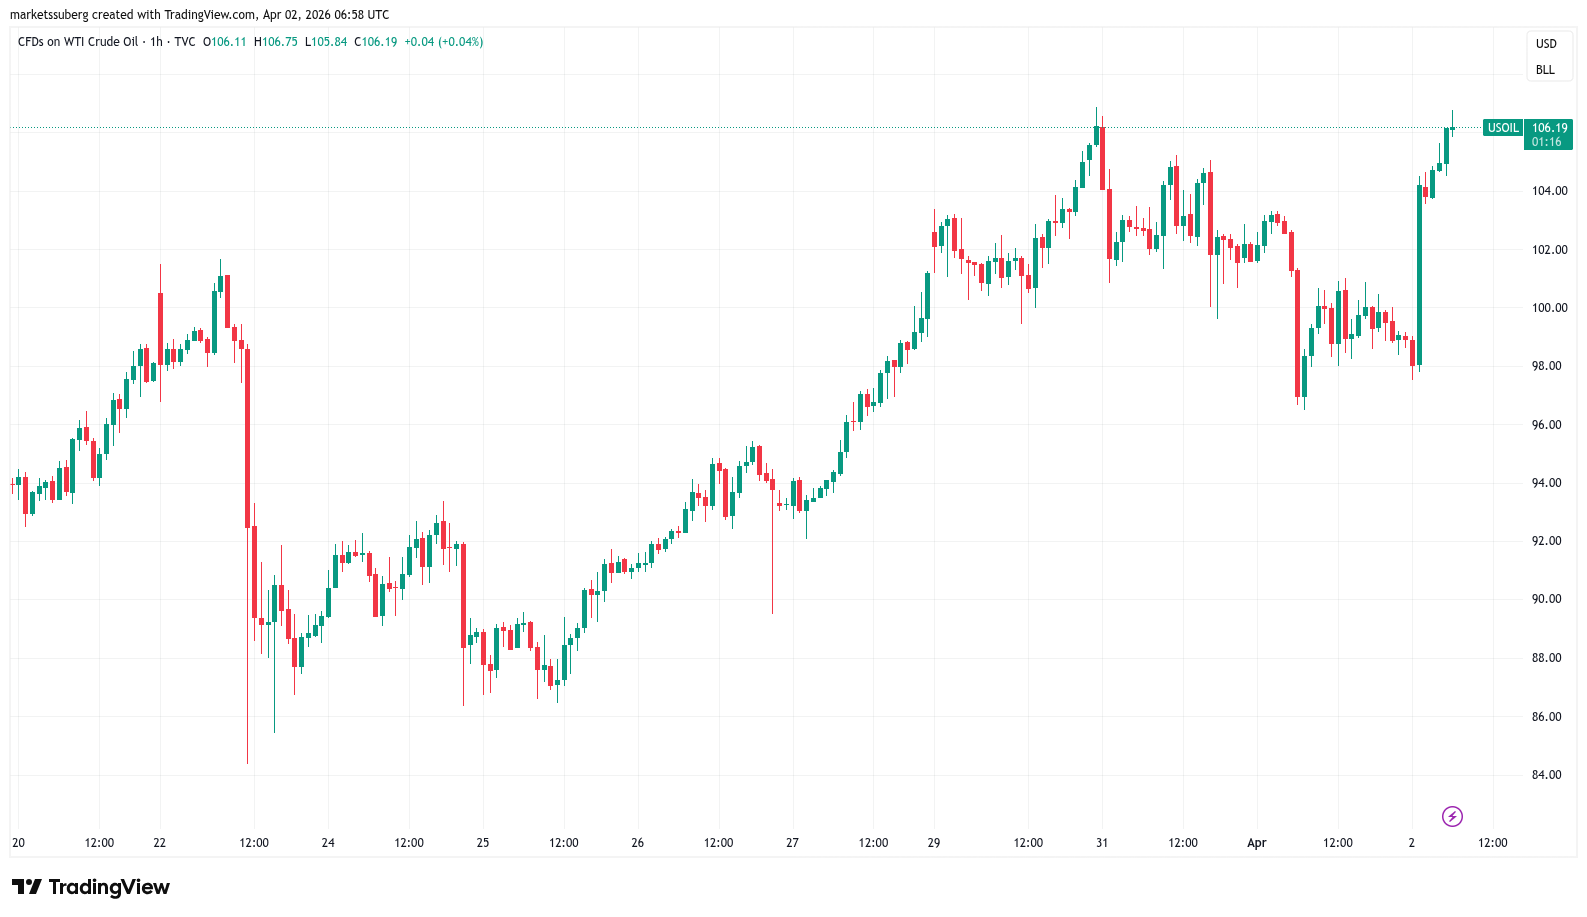
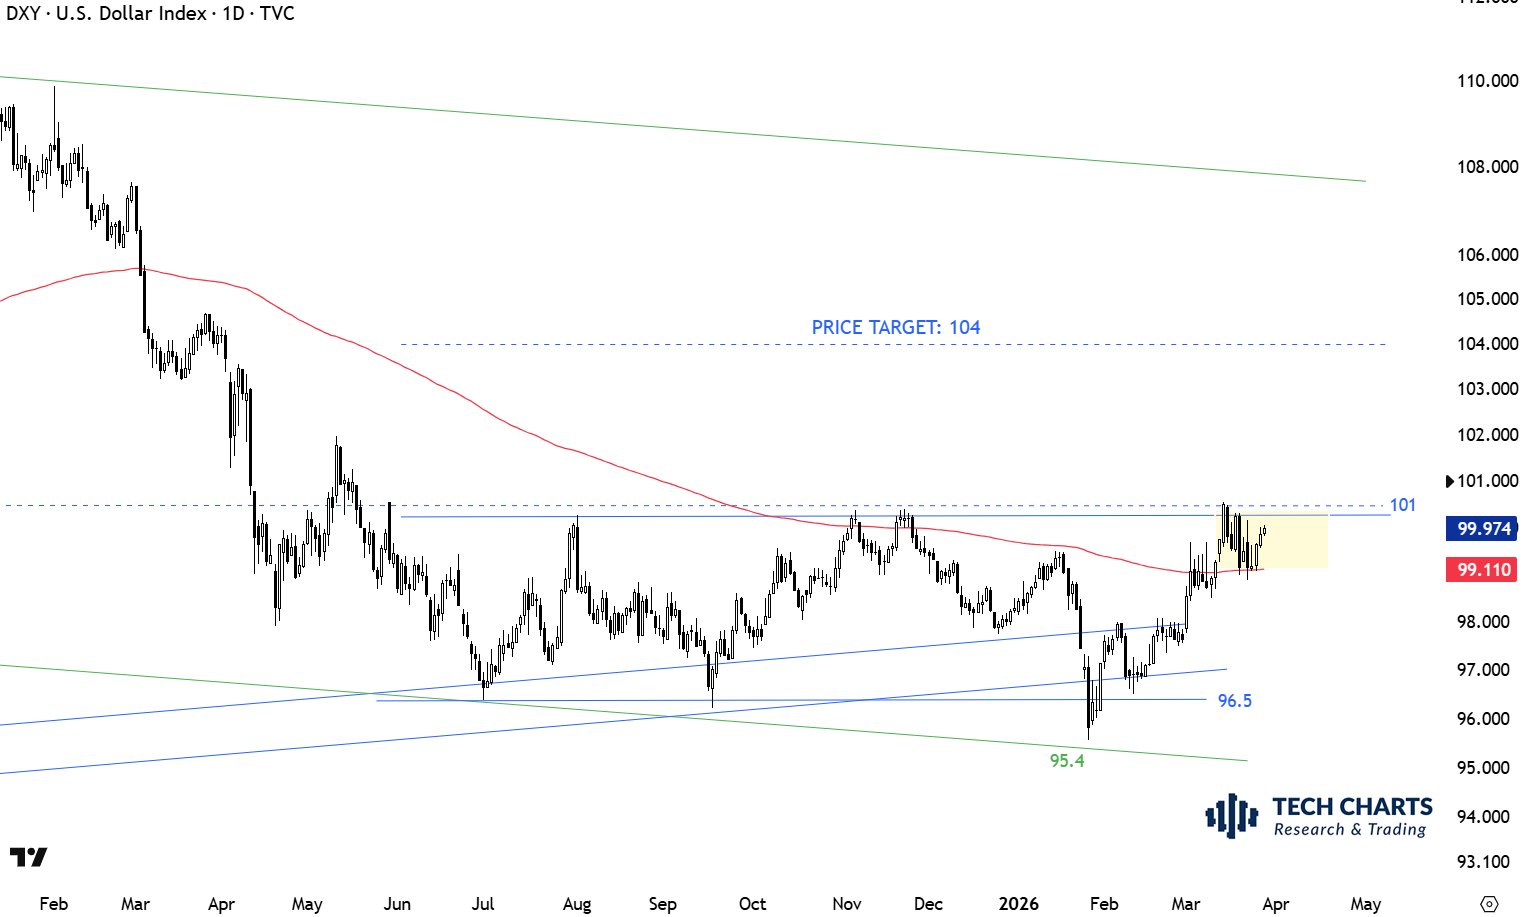
With oil firmly above the $100 per barrel mark, US dollar strength also rebounded to the key 100 level on the day.
Traditionally inversely correlated with Bitcoin, the US dollar index (DXY) was already tipped for a more significant rebound after hitting multi-year lows in January.
“DXY stage is set. We are waiting for that breakout confirmation,” trader and analyst Aksel Kibar told X followers last week, offering a target of 104 — its highest level since April 2025.
Crypto trader BitBull forecast an expansion phase for DXY next, with new lows for risk assets as a result.
$DXY looks like a classic downtrend, accumulation and expansion phase.
Downtrend has happened.
Accumulation has been ongoing.The next will be expansion which will send crypto and stocks to new lows. pic.twitter.com/aO5xN8Gncp
— BitBull (@AkaBull_) April 1, 2026
Analyst eyes copycat BTC price bear flag
Some market participants continued to focus on Bitcoin’s latest bear flag construction — one that also carried the risk of a breakdown.
Related: Bitcoin snaps 5-month losing streak: Key BTC price levels to watch in April
As Cointelegraph reported, BTC price action closely echoed a bear-flag support collapse seen at the start of 2026.
Commenting, Keith Alan, cofounder of trading resource Material Indicators, said that BTC/USD still lacks “directional momentum.”
“Structurally, $BTC price action is still nearly identical to the prior bear flag structure,” he wrote on X.
“Nothing says that it has to continue to mimic that price behavior, but I’m following it like roadmap until price deviates from that path.”
This article is produced in accordance with Cointelegraph’s Editorial Policy and is intended for informational purposes only. It does not constitute investment advice or recommendations. All investments and trades carry risk; readers are encouraged to conduct independent research before making any decisions. Cointelegraph makes no guarantees regarding the accuracy or completeness of the information presented, including forward-looking statements, and will not be liable for any loss or damage arising from reliance on this content.