
Bitcoin (BTC) gained up to 3% Sunday, but some traders refused to believe that the BTC price crash was over.
Key points:
-
Bitcoin price comparisons warn that new macro lows are due if the 2022 bear market continues to repeat.
-
Moving averages and the cost basis of the US spot Bitcoin ETFs are in focus.
-
Analysis says that a carbon copy of 2022 is not a certainty.
Bitcoin capitulation “hasn’t happened yet”
Data from TradingView showed BTC/USD crossing $71,000, now up 20% versus Friday’s 15-month lows.
As the weekly close neared, Bitcoin added characteristic volatility, while market participants remained highly skeptical that the rebound would last.
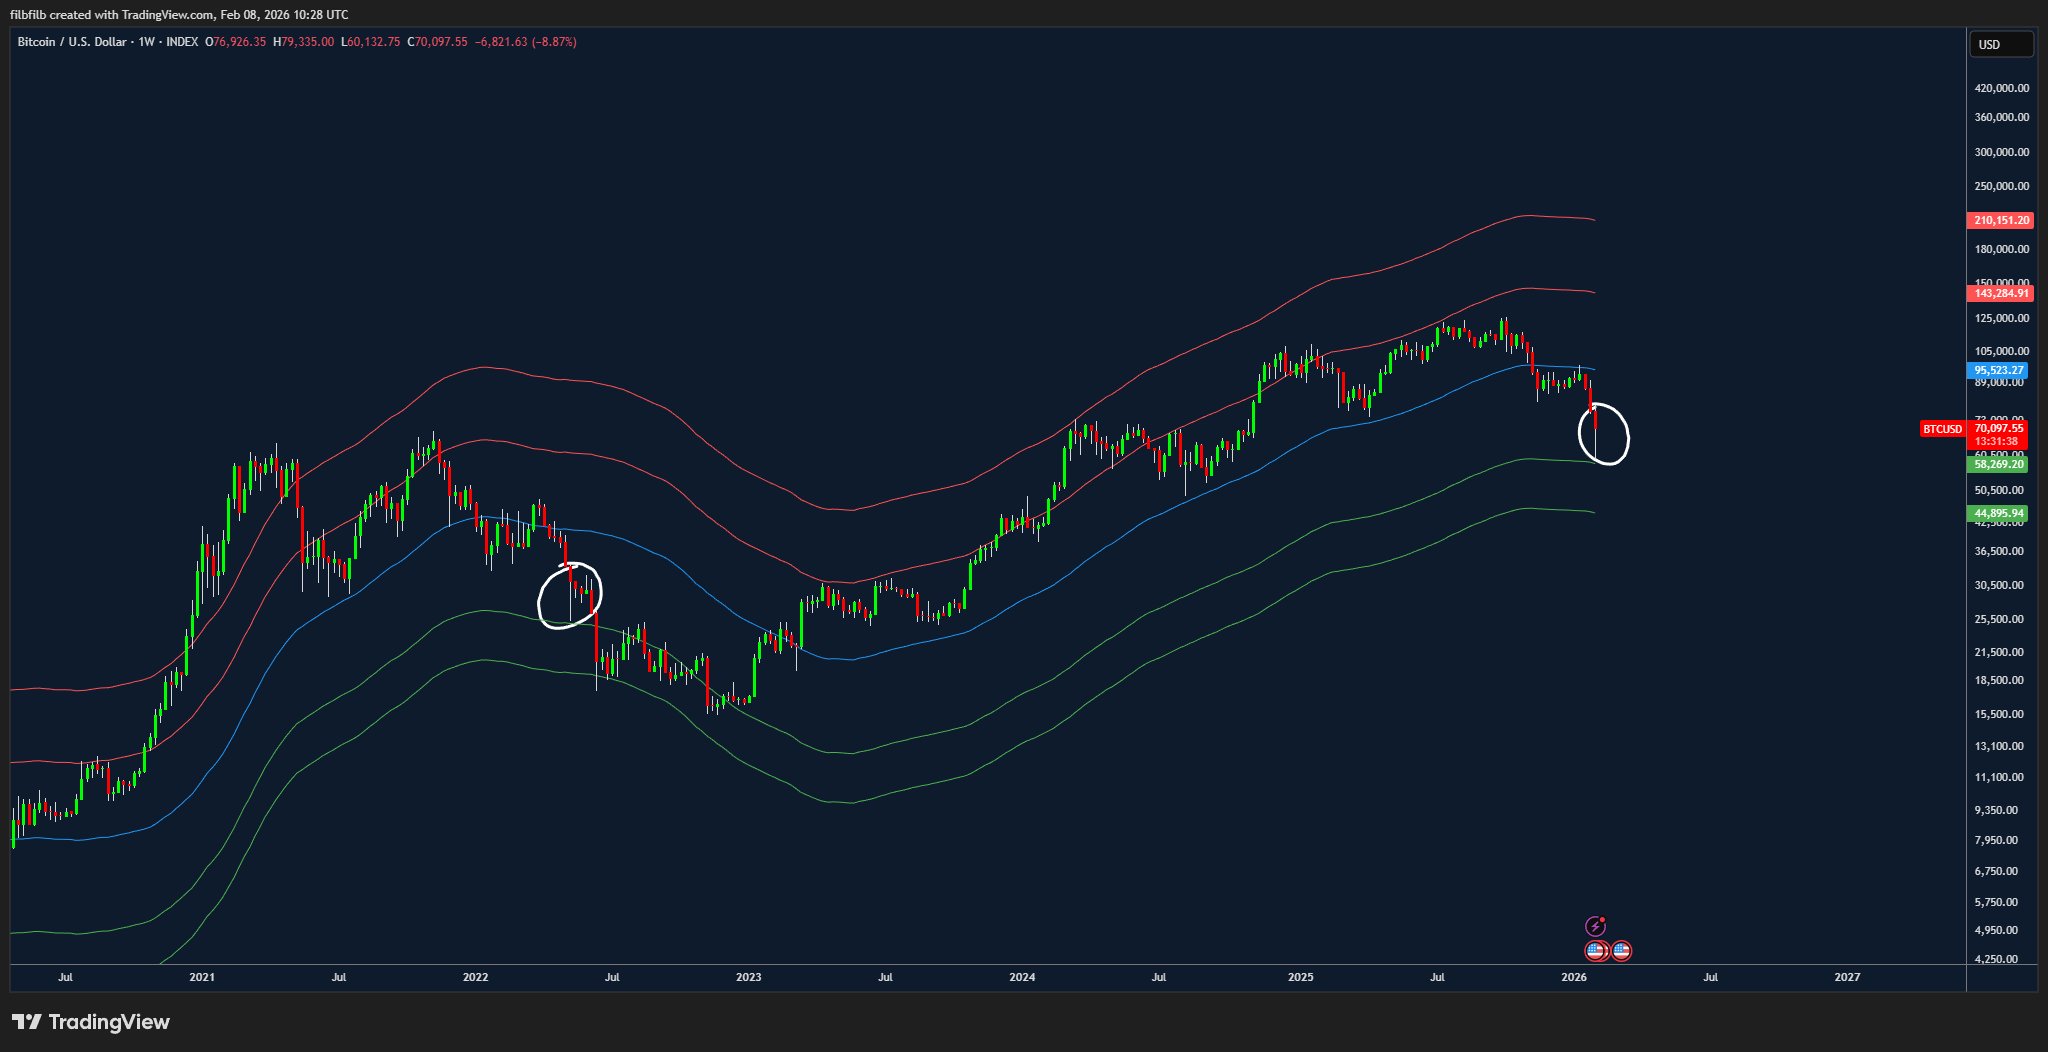
Uploading a chart to X which compared current BTC price action to the 2022 bear market, independent analyst Filbfilb had no good news for bulls.
“Im not going to try to dress it up any way other than how it looks,” he commented alongside a chart showing spot price versus the 50-week exponential moving average (EMA) at $95,300.
Analyst Tony Severino held similar ideas, contributing multiple price indicators and concluding that new lows were all but guaranteed.
Four more for your foresight https://t.co/psM23MQiI2 pic.twitter.com/Qu0Pt5QeUz
— Tony Severino, CMT (@TonySeverinoCMT) February 8, 2026
“$BTC final capitulation hasn’t happened yet,” trader BitBull agreed, like Filbfilb referencing 2022.
“A real bottom will form below $50,000 level where most of the ETF buyers will be underwater.”
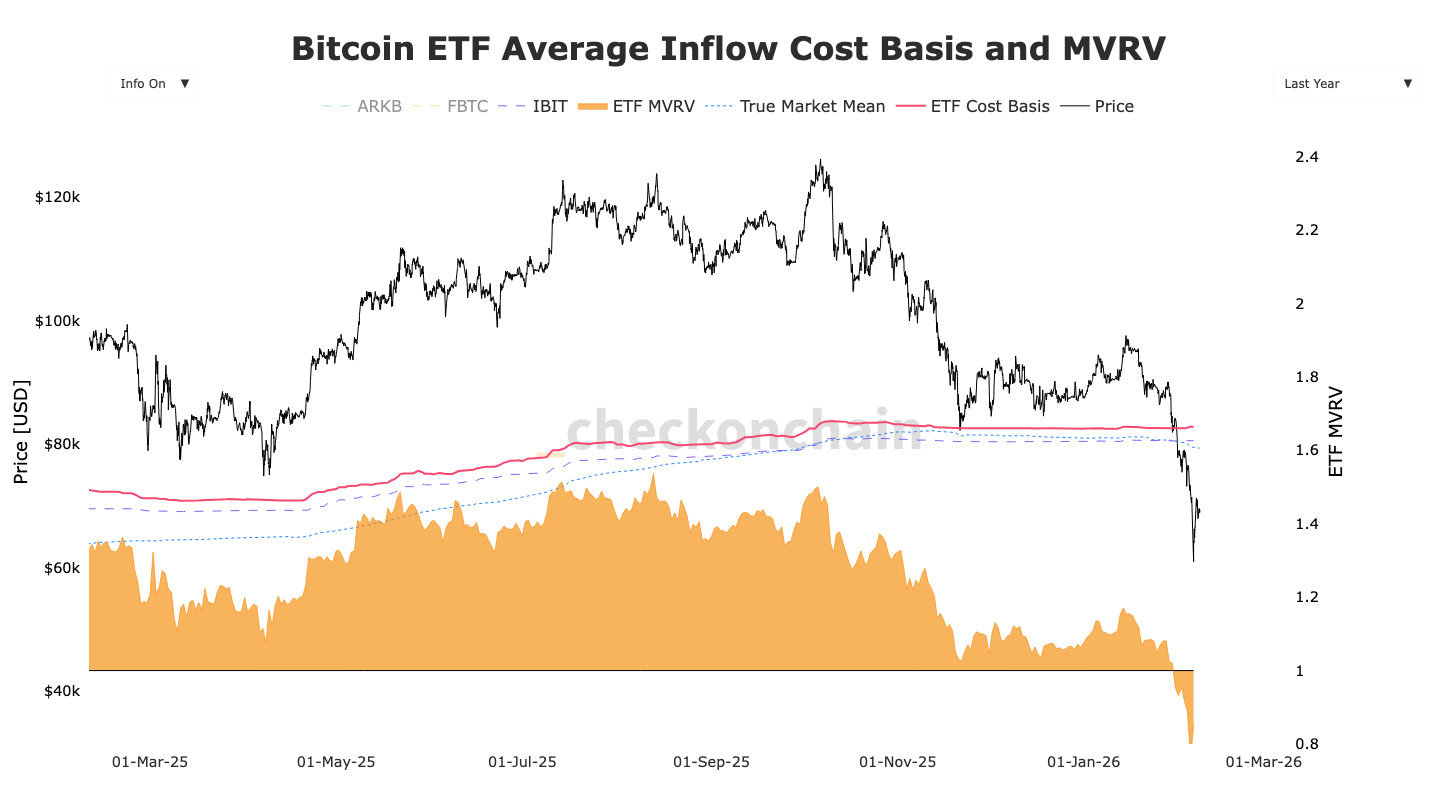
The US spot Bitcoin exchange-traded funds (ETFs) currently have an average buy-in cost of $82,000, per data from monitoring resource Checkonchain.
BTC price deja vu continues
Earlier, Cointelegraph reported on a key bear market feature for Bitcoin based on two other trend lines: the 200-week simple (SMA) and exponential moving averages.
Related: What crashed Bitcoin? Three theories behind BTC’s trip below $60K
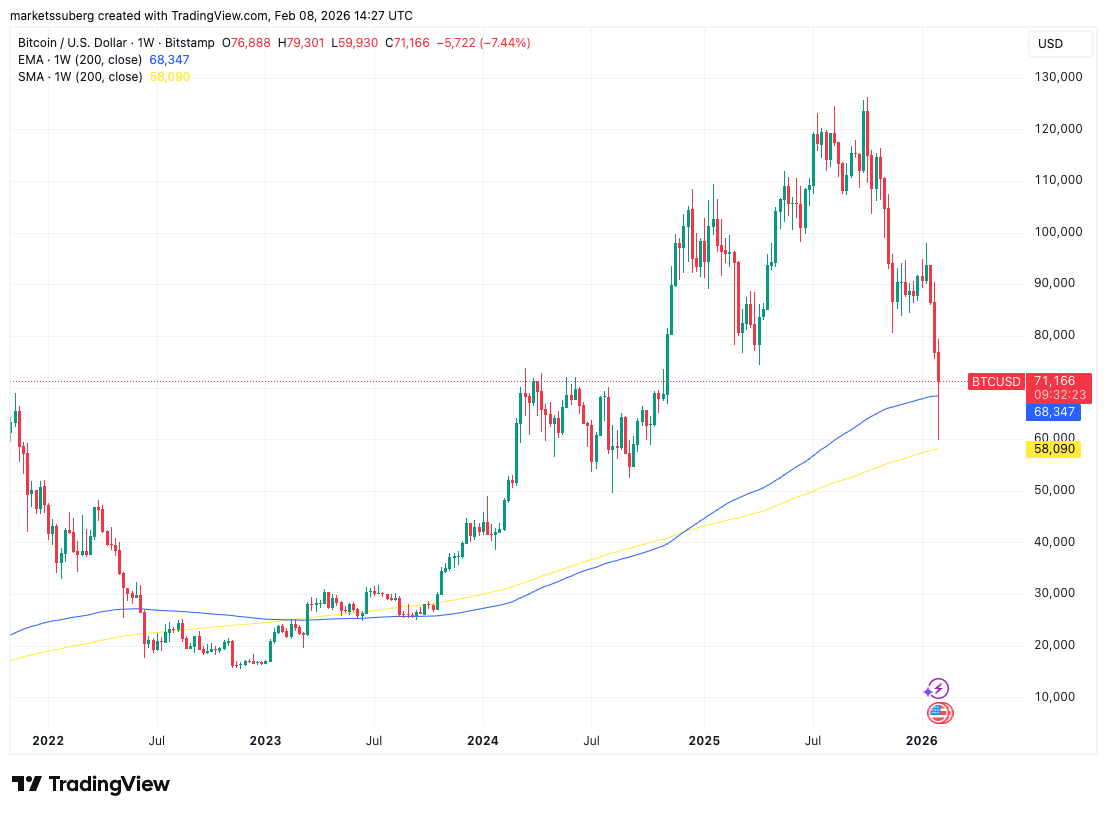
Together, they form a “cloud” of support between $58,000 and $68,000.
In one of his latest market takes at the weekend, Caleb Franzen, creator of analytics resource Cubic Analytics, argued that here too, the ghost of 2022 was in play.
“In May 2022, Bitcoin retested its 200-week MA cloud. Bulls said ‘that’s it, we’ve retested the long-term moving average & can continue higher now.’ Price immediately rebounded on that zone, produced a long wick, & closed above the midpoint of the weekly range,” he summarized.
“But then that rally faded… Price came back into the 200W MA cloud a few weeks later, failed to rebound, then sliced through the cloud in June 2022. What are we seeing right now? The first retest of the 200W MA cloud with a long wick.”
Franzen note that the market may not replicate the previous bear market “perfectly.”
“The reality is that no one knows what happens next,” he acknowledged.
This article does not contain investment advice or recommendations. Every investment and trading move involves risk, and readers should conduct their own research when making a decision. While we strive to provide accurate and timely information, Cointelegraph does not guarantee the accuracy, completeness, or reliability of any information in this article. This article may contain forward-looking statements that are subject to risks and uncertainties. Cointelegraph will not be liable for any loss or damage arising from your reliance on this information.


