Bitcoin (BTC) stayed tightly rangebound at the April 3 Wall Street open as analysts counted down to volatility.
“Watch for rugs” on BTC
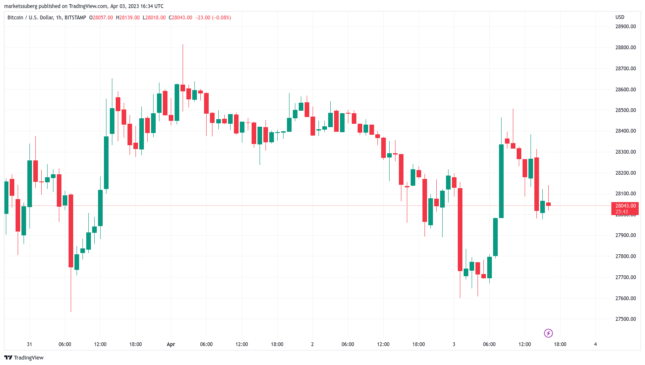
Data from Cointelegraph Markets Pro and TradingView followed BTC/USD as it lingered around $28,000 on Bitstamp.
The weekend had finished on an erratic note as news of a Opec+ oil production cut sent crypto tumbling before a rebound during the Asia trading session.
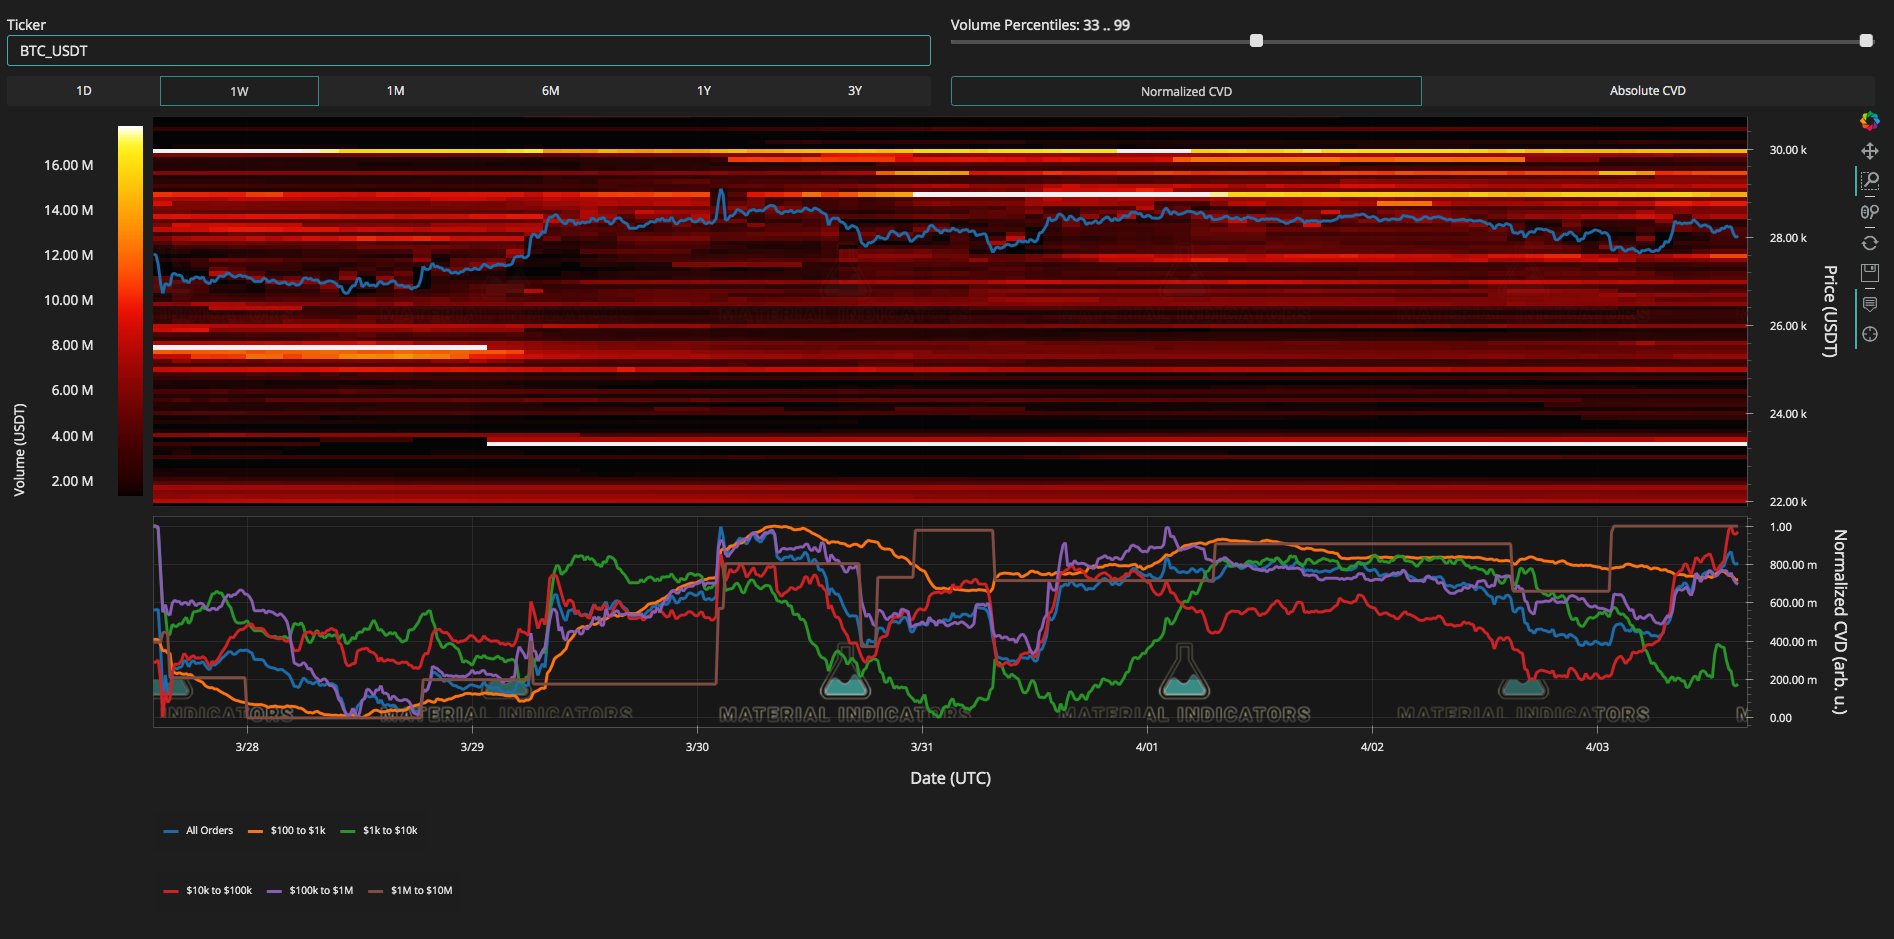
Amid a lack of clear direction, monitoring resource Material Indicators flagged significant liquidity on either side of spot price on the Binance order book.
“We still don’t have a confirmed breakout or breakdown, only rejected attempts which have kept price chopping in this range,” part of fresh Twitter commentary added.
“It’s only a matter of time until one side breaks. Watch for rugs.”
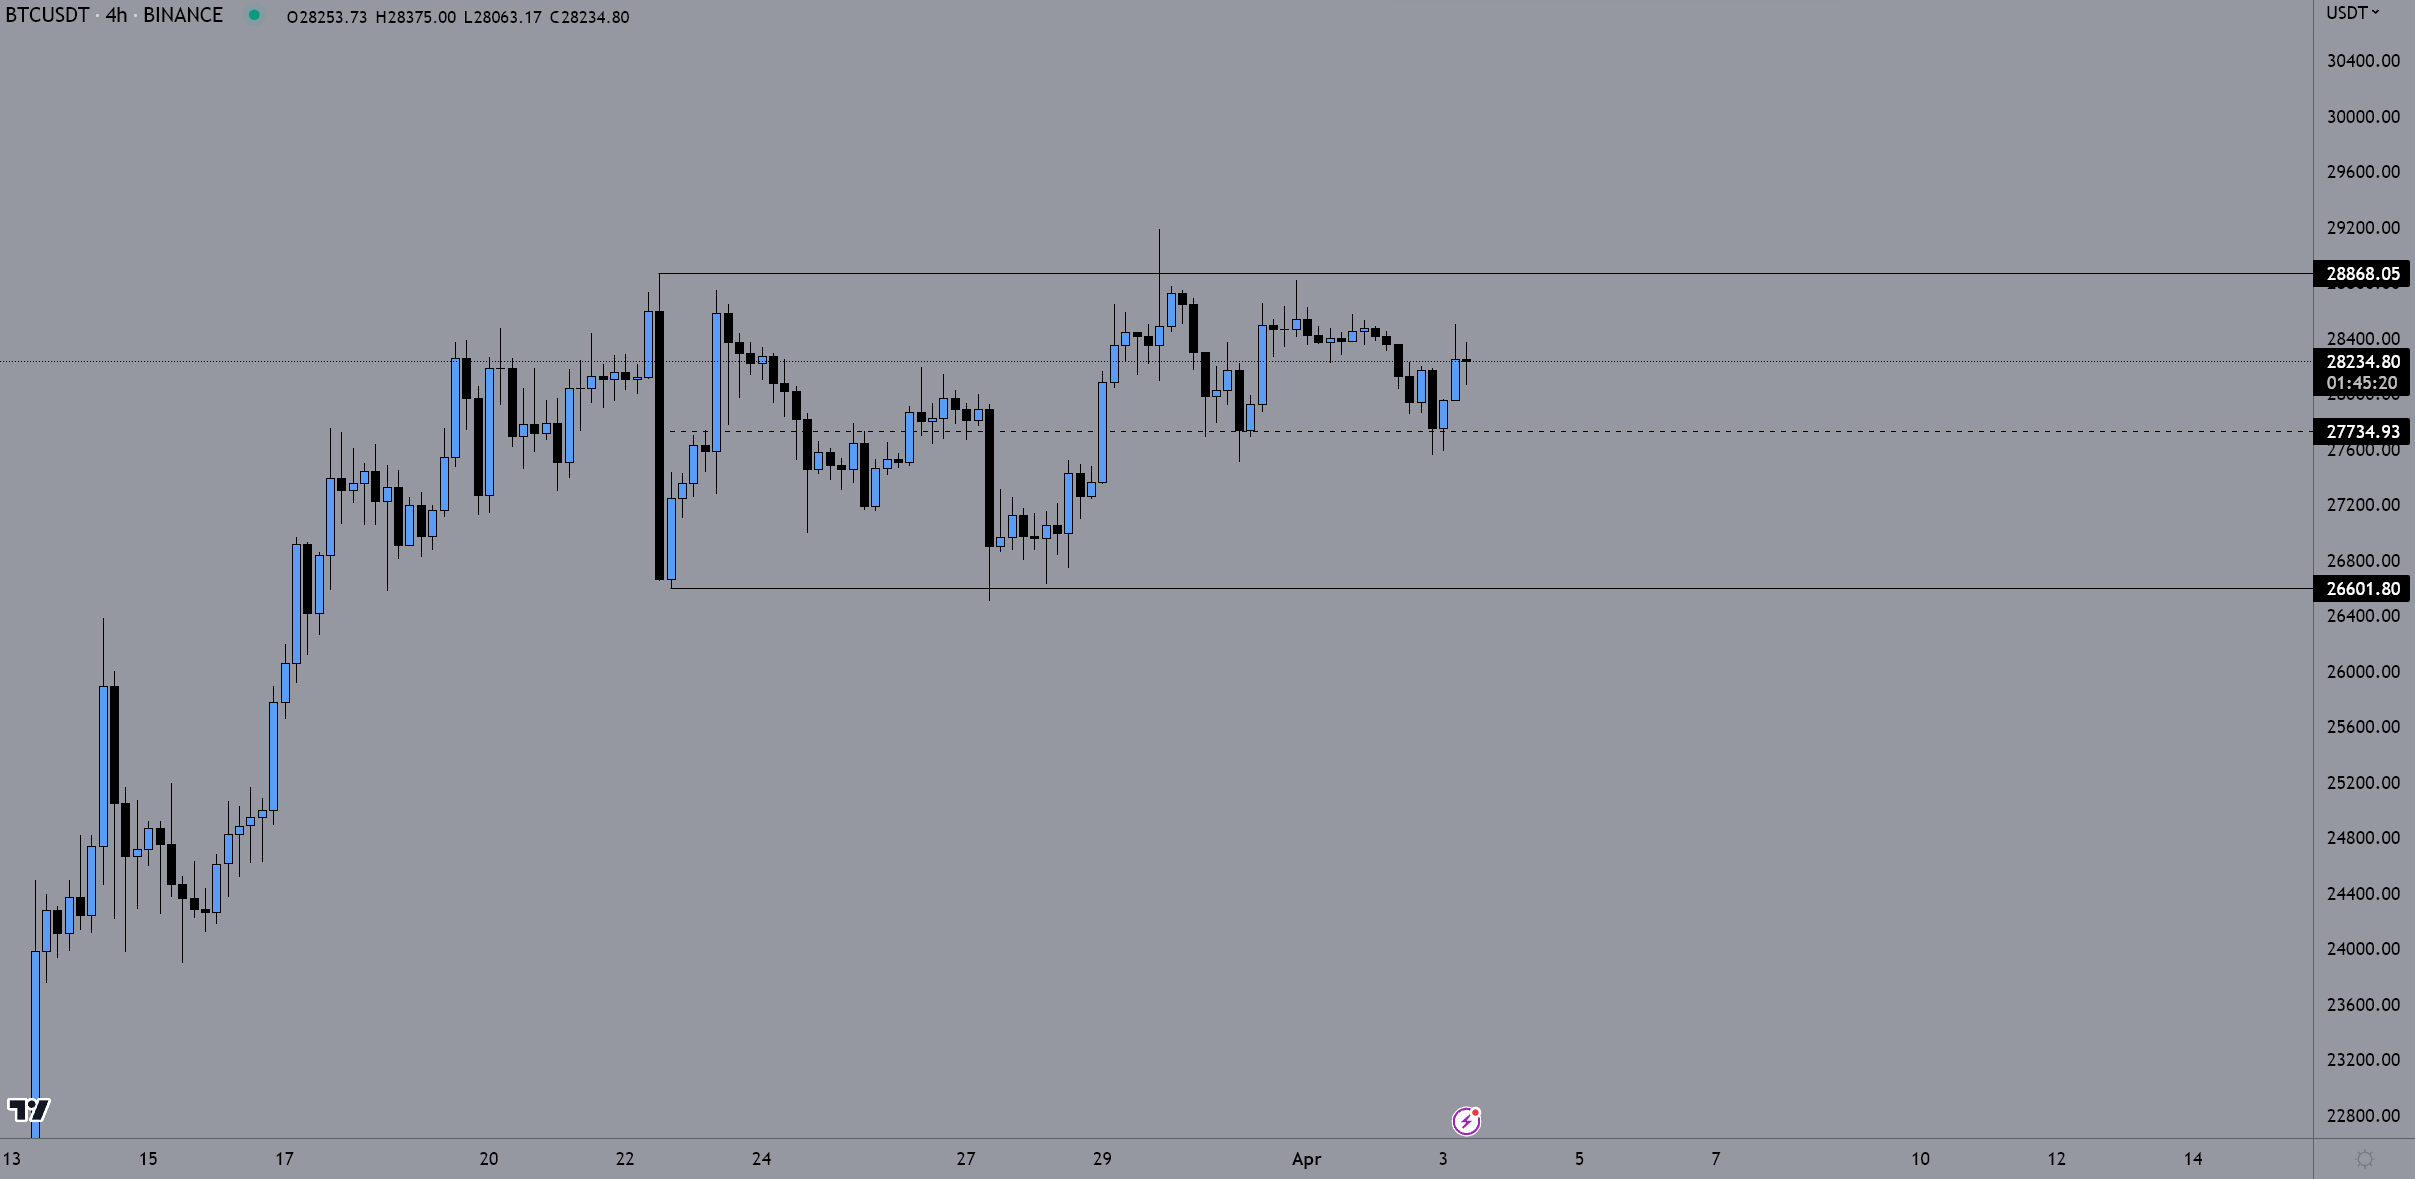
Popular trader Crypto Chase agreed that BTC price action remained stagnant.
“Range bound,” he summarized, referring to the equilibrium price (EQ) at $28,234 — the midpoint of the upper and lower bounds of the trading range — holding over the weekend.
“Range EQ providing support for the past 4 days. Bulls want to see acceptance / daily close above 28.9K for expansion. Bears want a significant close below range EQ. At that point, prior support from EQ could flip to resistance sending price to retest range low.”
Related: US enforcement agencies are turning up the heat on crypto-related crime
Others were more categorical in their market appraisals. Maartunn, a contributor at on-chain analytics platform CryptoQuant, turned to longer timeframes to place emphasis on the success of the March monthly close.
Bitcoin has confirmed a break-out from a multi-month consolidation, and funding rates are negative pic.twitter.com/vBs7ipK8hw
— Maartunn (@JA_Maartun) April 3, 2023
By contrast, trader and analyst Rekt Capital warned that a retracement could be imminent.
#BTC continues to struggle at the Higher High resistance (black)$BTC will continue to be non-trending as it consolidates between the Higher High resistance & the green support at $27,000
Drop into green could occur soon
Lose that -> deeper retrace confirmed#Crypto #Bitcoin https://t.co/8sG1jswkDr pic.twitter.com/lsqDlenUpS
— Rekt Capital (@rektcapital) April 3, 2023
DXY heads lower after brief comeback
On macro, United States equities showed mixed results at the open, with the S&P 500 treading water and the Nasdaq Composite Index down 0.8%.
Related: BTC price double top forming? 5 things to know in Bitcoin this week
The U.S. dollar index (DXY), having initially benefitted from the Opec+ announcement, continued falling through the day, at one point wicking below 102, almost matching two-month lows.
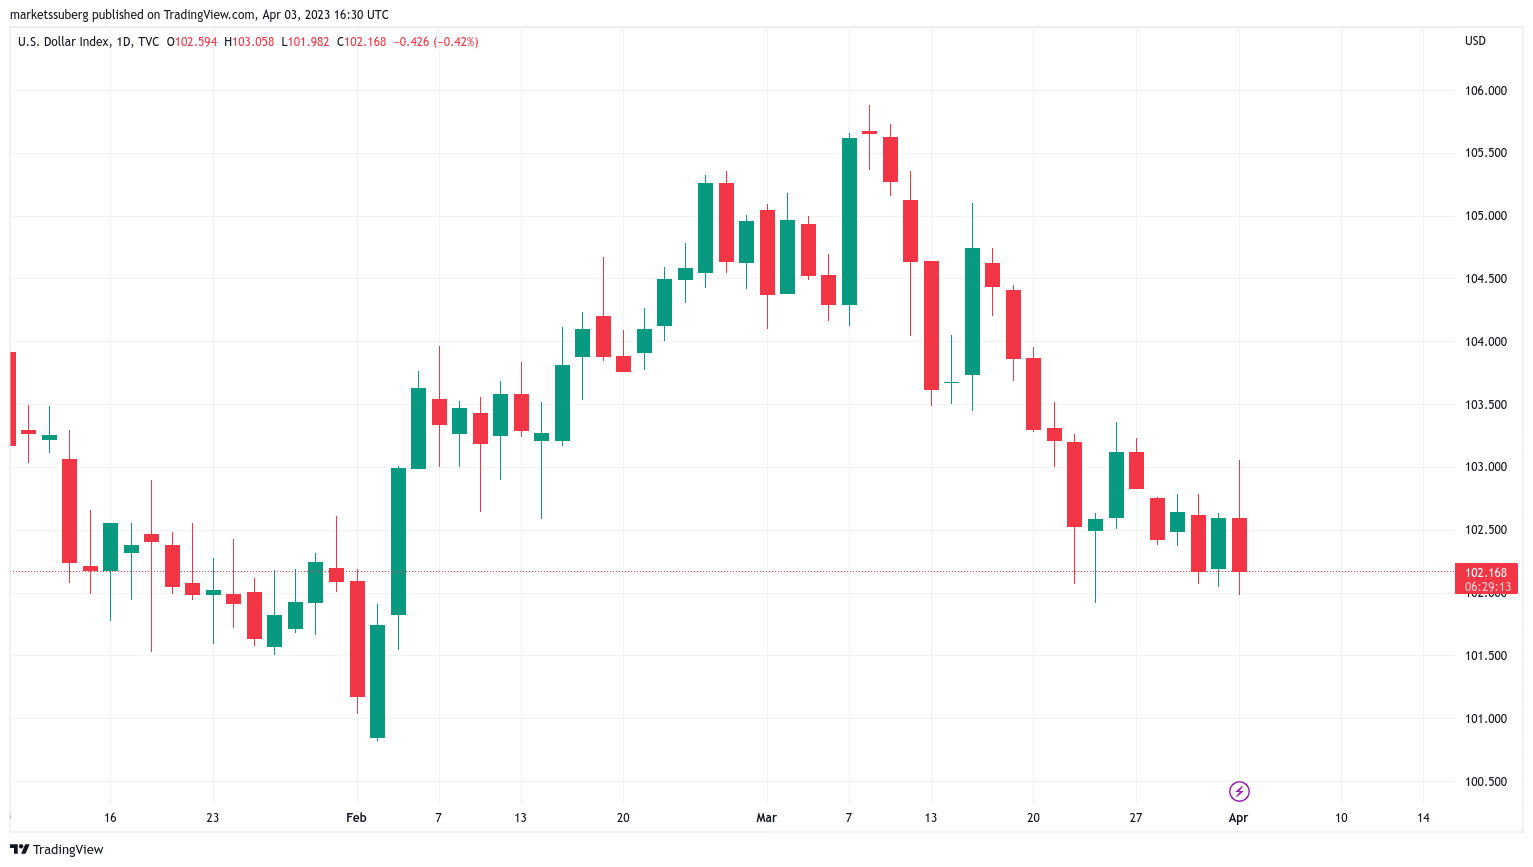
“DXY has been rejected at its 50-week moving average,” analytics account Game of Trades noted the day prior.
“A bearish rejection on the MACD has increased the probability for further downside.”
The views, thoughts and opinions expressed here are the authors’ alone and do not necessarily reflect or represent the views and opinions of Cointelegraph.


