Still, indicator was pointing bullishly. A price pattern called “throwback” has emerged on bitcoin’s daily chart that could recharge bulls’ engines for a rally toward $37,000, according to Valkyrie Investments. In technical analysis, a throwback is a price drop to a former breakout level or resistance-turned-support. After a breakout, prices rally for some days before losing upward momentum and returning to the breakout point. More often than not, prices surge after the throwback is completed, Thomas Bulkowski detailed in his book “Visual Guide to Chart Patterns.”
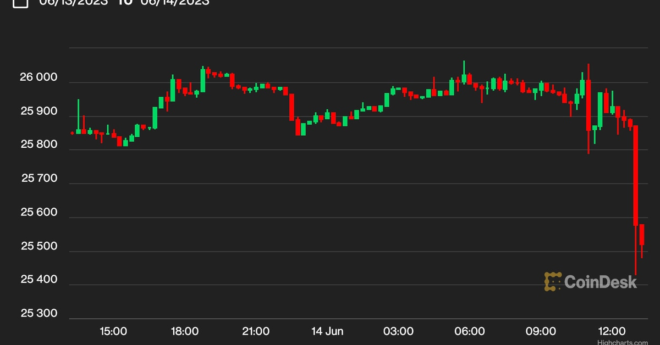
Bitcoin BTC Price Holds Sinks to 25.5K as Investors Shrug Off Fed Rate Hike Pause