
Key points:
-
BTC price action retargets $105,000 after the Wall Street open, rising 2.5% from the day’s lows.
-
Volatility continues, leading market participants to varying conclusions over what will happen to BTC/USD next.
-
Perspectives include the Bitcoin bull market being in its final stages.
Bitcoin (BTC) sought a rebound from a 4% dive at the May 19 Wall Street open as traders diverged on bull market strength.
$106,000 becomes BTC price zone to watch
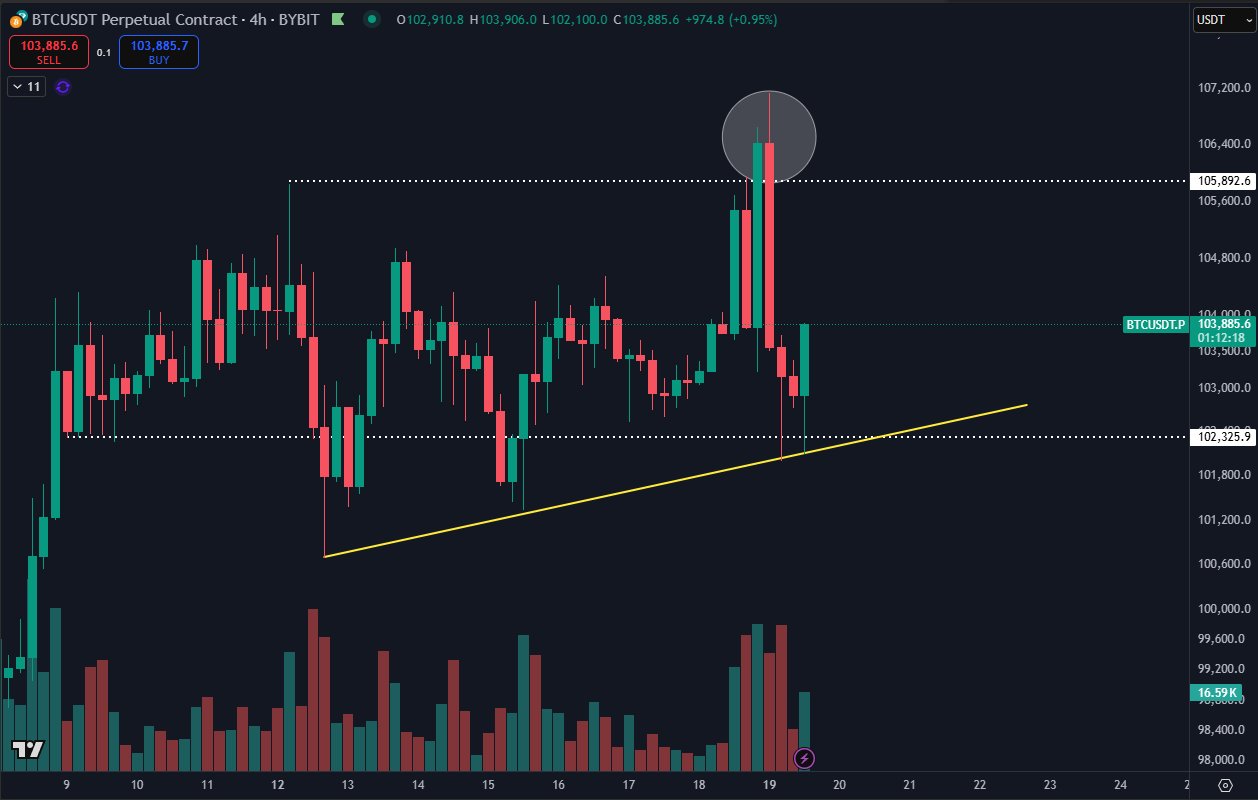
Data from Cointelegraph Markets Pro and TradingView showed BTC/USD passing $104,500, up 2.5% from the day’s low.
The pair had seen flash volatility around the weekly close, which although the highest ever recorded swiftly saw bulls lose control.
Now, opinions differed about when, or if, new all-time highs would come.
“This is exactly what Bitcoin needs to be doing,” an optimistic Rekt Capital wrote in part of his latest X analysis.
“Needs to hold ~$104400 as support to position itself for a successful post-breakout retest.”

Popular trader Daan Crypto Trades flagged $102,000 and $106,000 as the levels to watch above and below spot price.
“These mark the local range low and high and price has been trading within these for most of the last 1-2 weeks,” he explained in part of his own X post.
“Keep an eye out for a clean break below either of these. So far, price has not sustained above or below for more than a day.”
The area around $106,000 was also on the radar for onchain analytics firm Glassnode.
“BTC’s price surge stalled just below $106.6K – a level with 31K $BTC held at that cost basis,” it observed on the day.
“This supply cluster originated on Dec 16 and remains unshaken. Holders haven’t redistributed, nor averaged down – making $106.6K an important level to watch in the short term.”

Trader: “Too many bearish signs to ignore” on Bitcoin
A renewed warning meanwhile came from fellow trader Roman, who considered weekly timeframes to be no longer in bulls’ favor.
Related: $107K fakeout or new all-time highs? 5 things to know in Bitcoin this week
“Not a good close as we rejected resistance, created more bearish divergences, and have pumped with low volume. Stoch RSI has also topped,” he summarized.
“Too many bearish signs to ignore, and it’s why I’ve been continuously saying the bull run is likely almost over.”
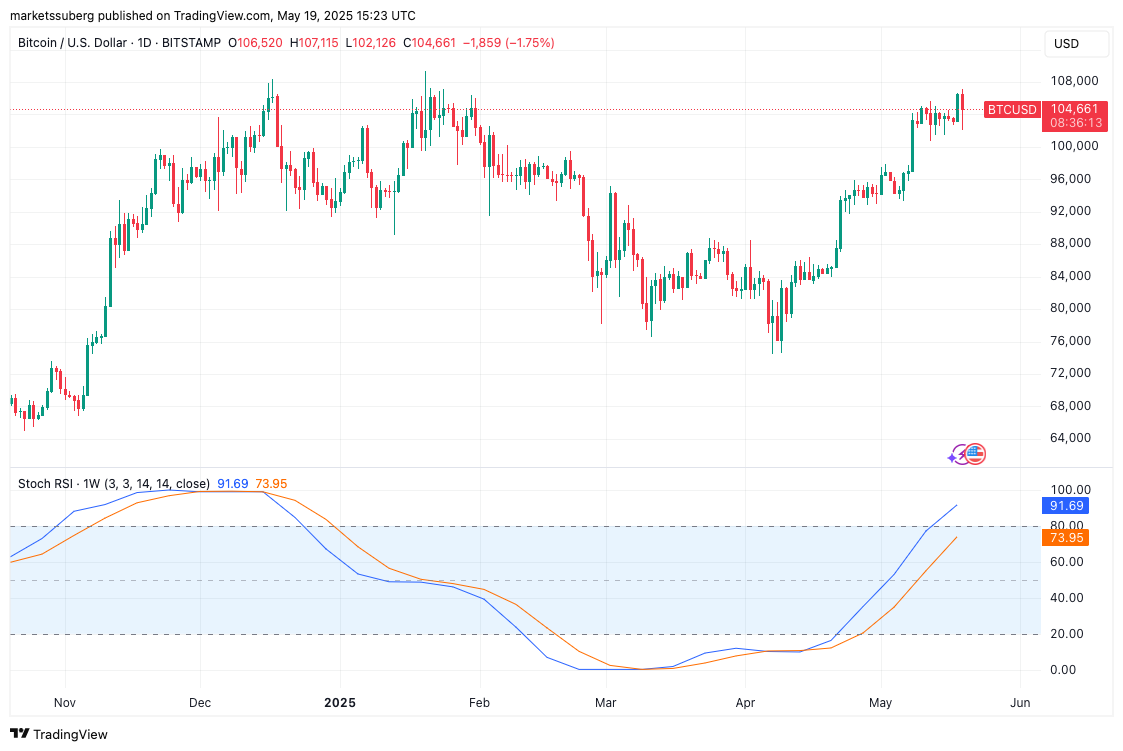
Roman referred to the stochastic relative strength index (RSI) indicator, a trend strength tool now firmly in “overbought” territory.
As Cointelegraph reported, various short-term BTC price predictions have surfaced in recent days, including an “early week” target of $116,000 along with a potential retracement toward $90,000.
This article does not contain investment advice or recommendations. Every investment and trading move involves risk, and readers should conduct their own research when making a decision.


