
Bitcoin (BTC) starts a new week at an important crossroads as analysis sees the chance for a new short squeeze
-
Bitcoin closes the week above a key 200-week trend line, leading to fresh belief in a trip to $75,000.
-
Liquidations stay elevated, with a trader noting that longs should be in the driving seat going forward.
-
US inflation data piles up, saving risk-asset volatility for later in the week.
-
Bitcoin onchain profitability data paints a dangerous picture, with the net unrealized profit and loss ratio hitting three-year highs.
-
Loss-making UTXOs suggest that Bitcoin may be at the start of a new bear market.
Bitcoin faces 2024 range and “a lot of uncertainty”
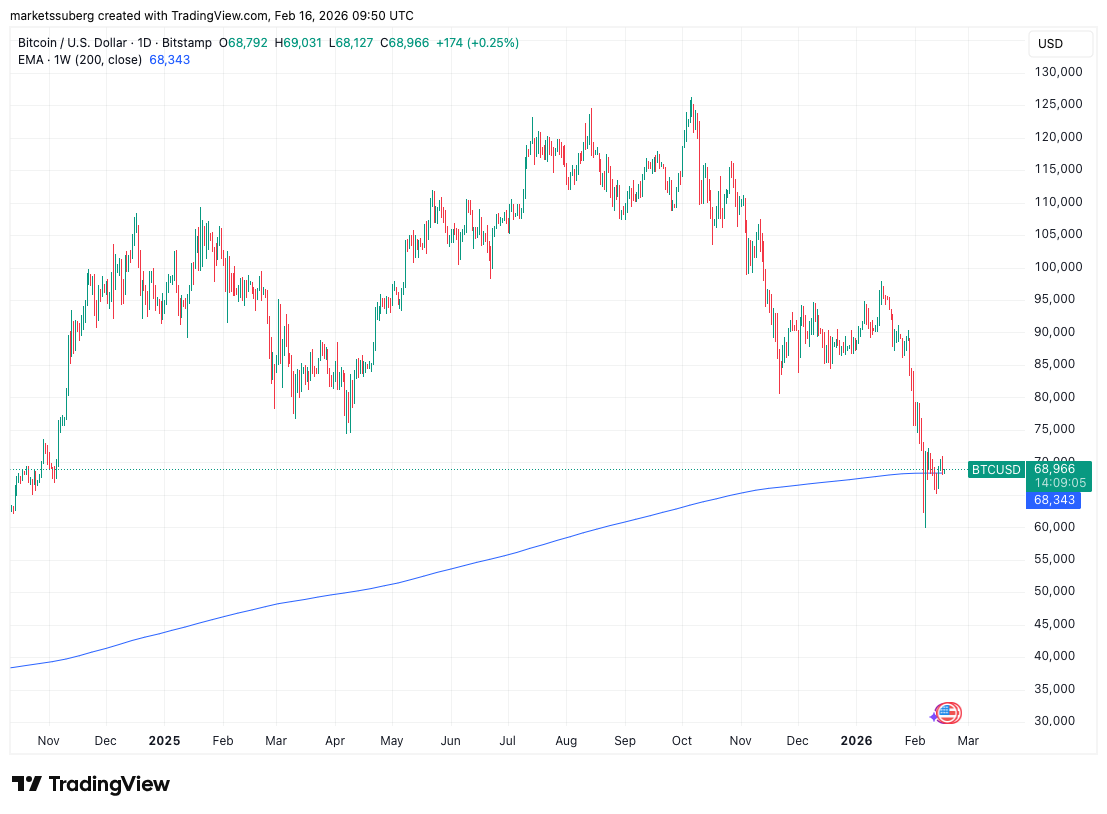
Bitcoin saw a surprisingly calm weekly candle close Sunday, but traders know the significance of the current price range.
At around $68,800 on Bitstamp, per data from TradingView, the weekly close came in above a key long-term trend line that will be key to future upside.
Currently at $68,343, the 200-week exponential moving average (EMA) forms one of two nearby lines in the sand for market participants. The other is Bitcoin’s old all-time high from 2021 at just over $69,000.
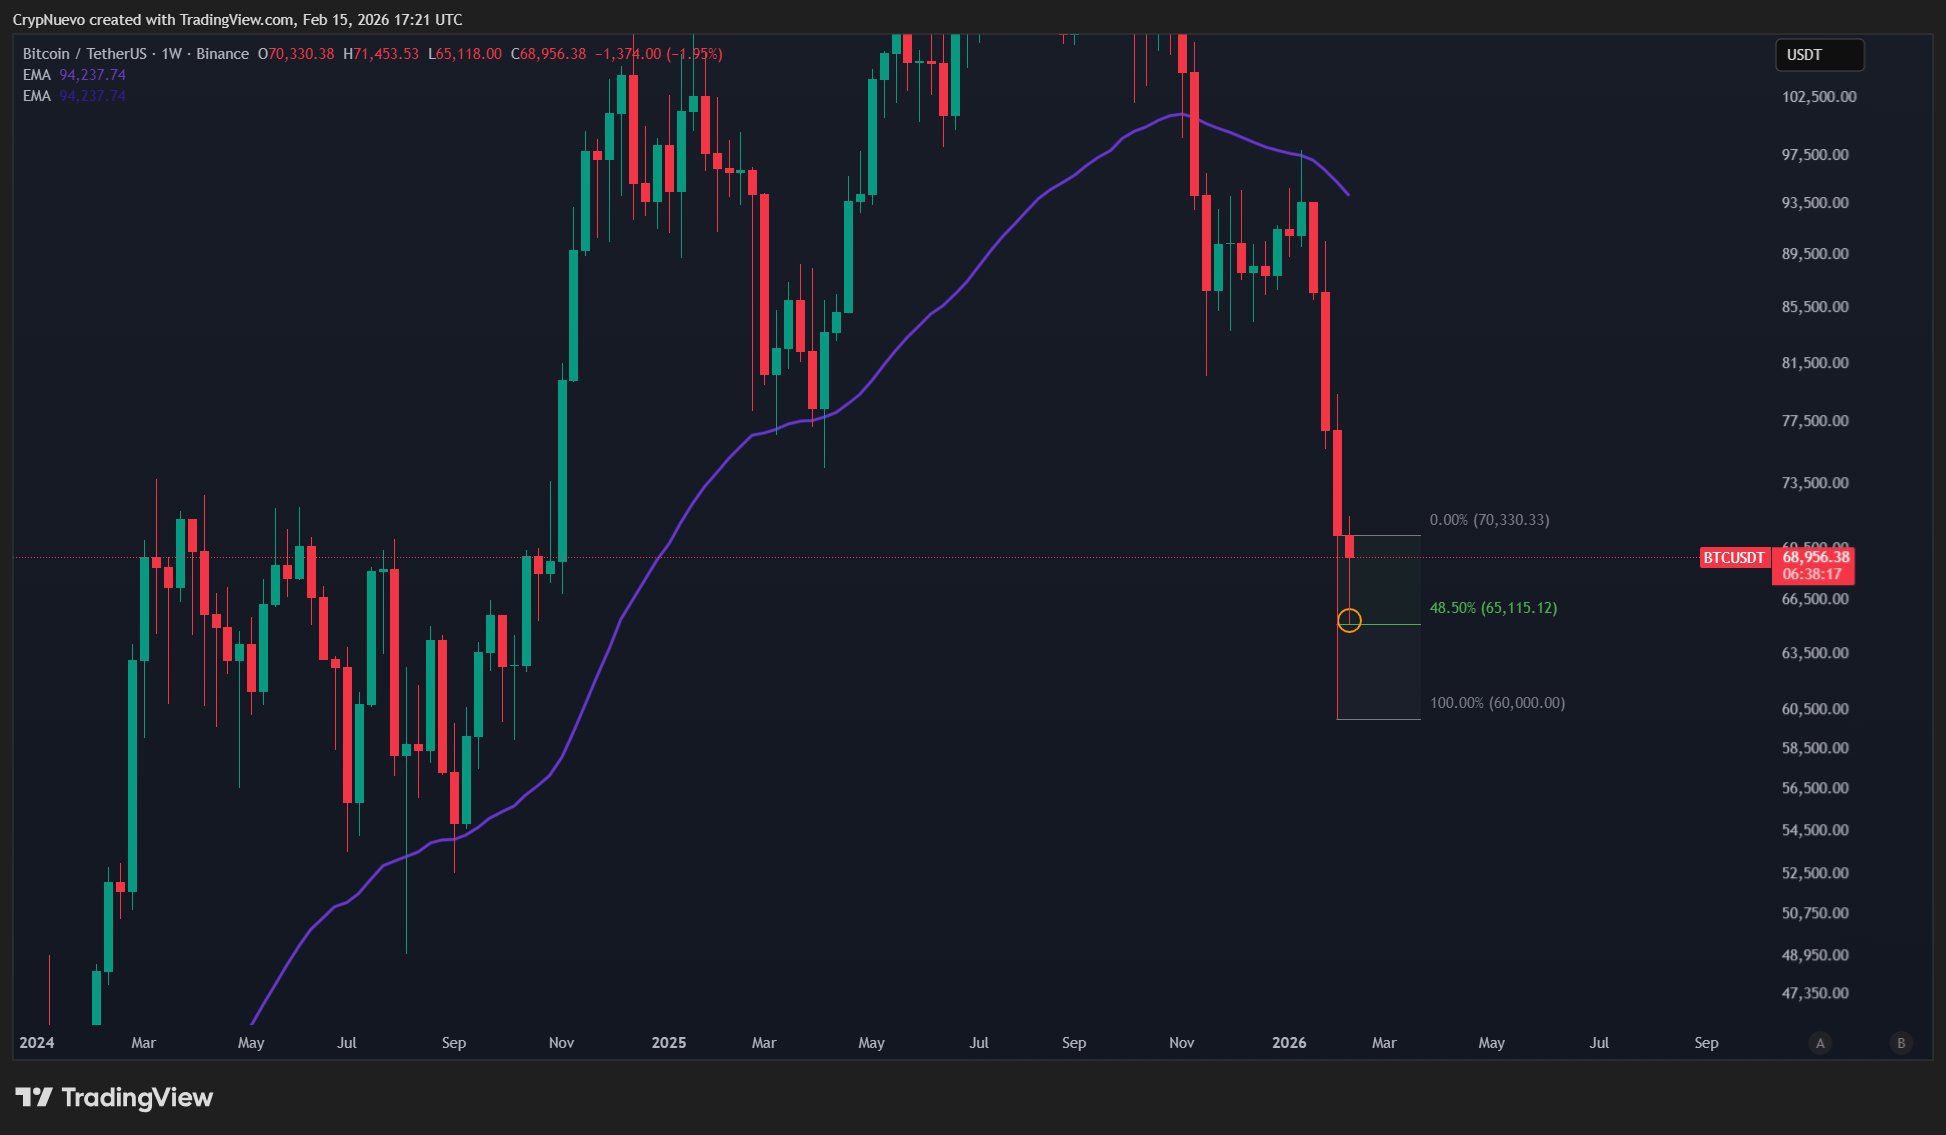
“We’re back inside an old important range that kept price for 7 months!” trader CrypNuevo wrote in his latest X analysis.
CrypNuevo referenced the extended rangebound construction focused around the $69,000 mark that BTC/USD formed in 2024.
He noted that last week, the pair filled almost half of its wick to 15-month lows from earlier in February — something that could have significance for the broader price trend.
“So Bitcoin might range here for some time, meaning that price could test the range lows,” the analysis continued.
“Only if: 1. Bitcoin drops back to the 50% wick-fill level (signal for 100% wick-fill). 2. Acceptance below 100% wick.”
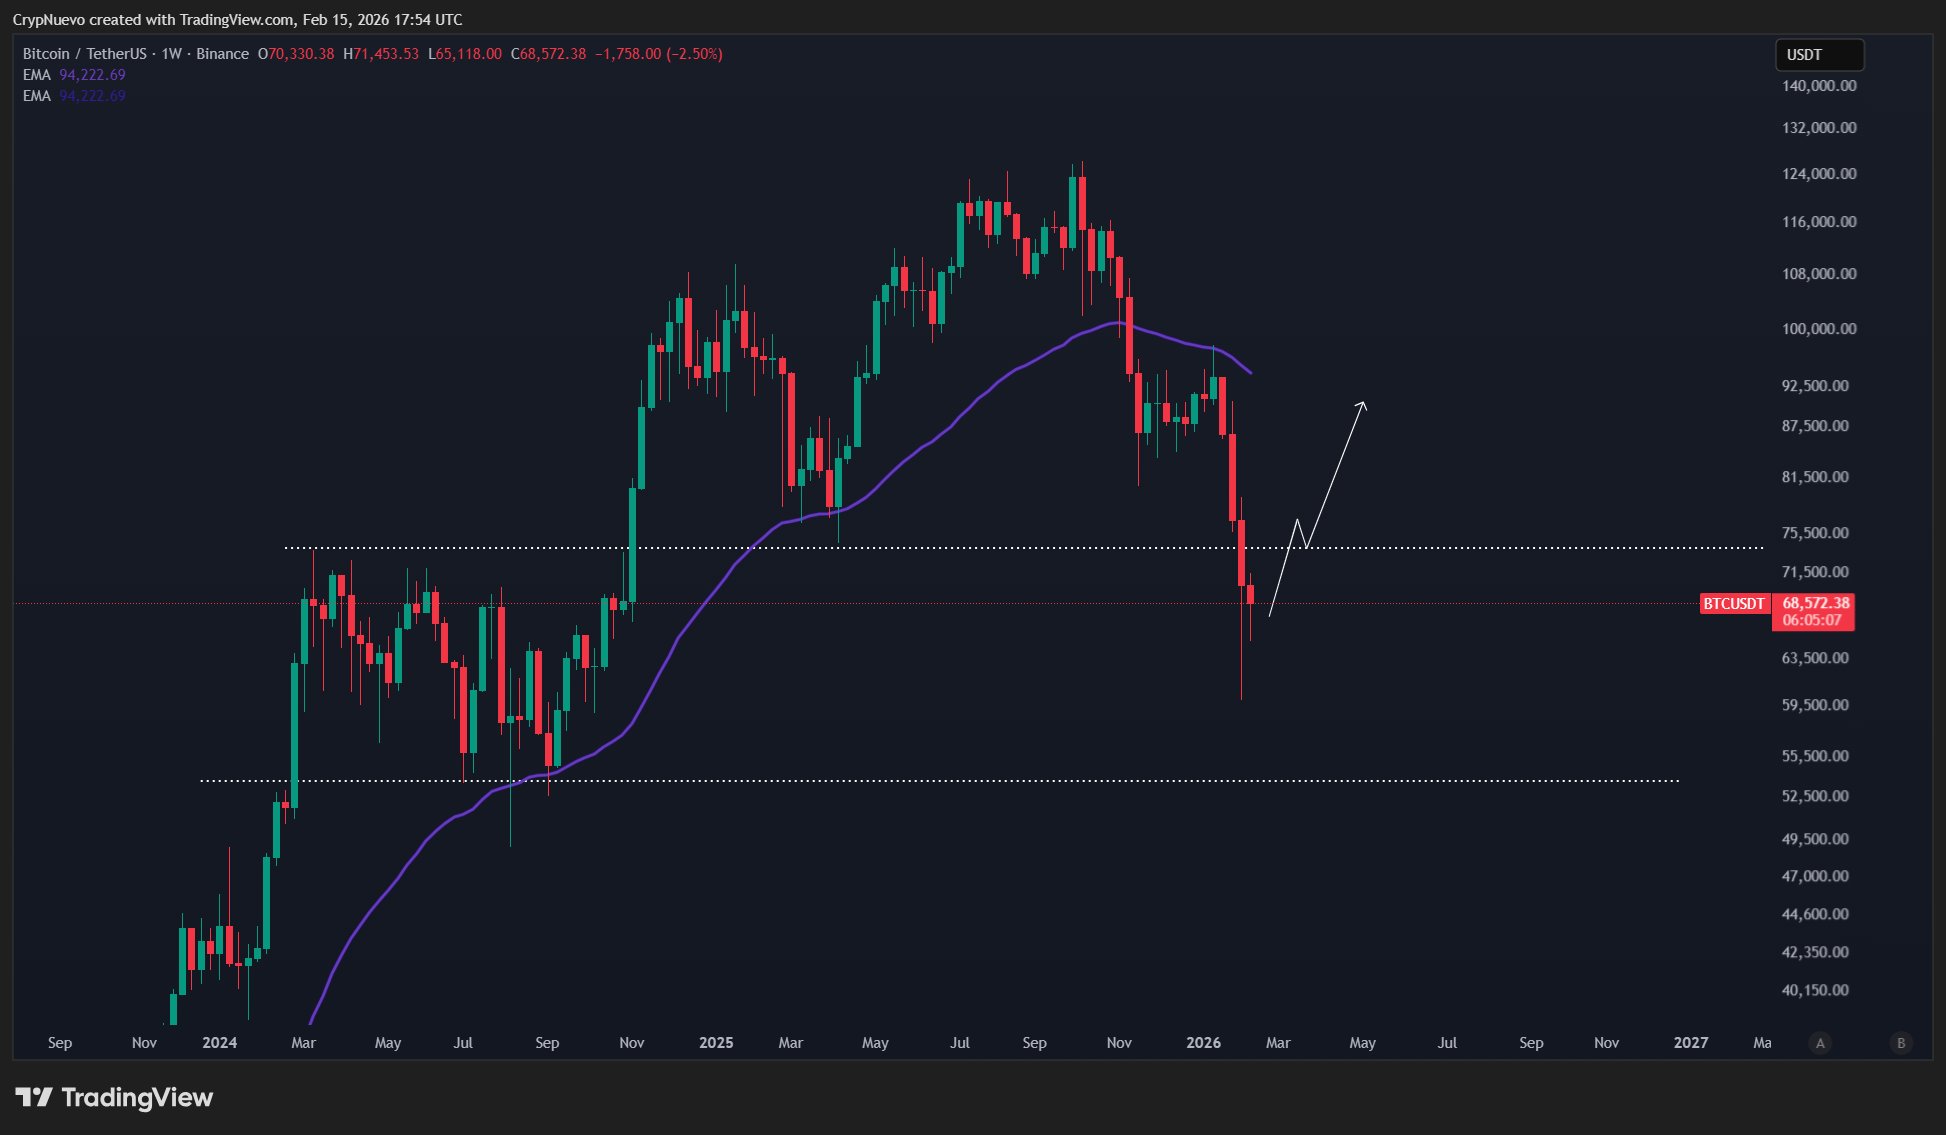
CrypNuevo flagged a rebound to $75,000 as the move that could trigger a “surprise recovery,” adding that Bitcoin “tends to do the opposite of the market sentiment.”
“A lot of uncertainty for the upcoming week. Also, Monday is bank holiday in the US so expecting irregular volatility (probably low volatility that day),” he concluded.
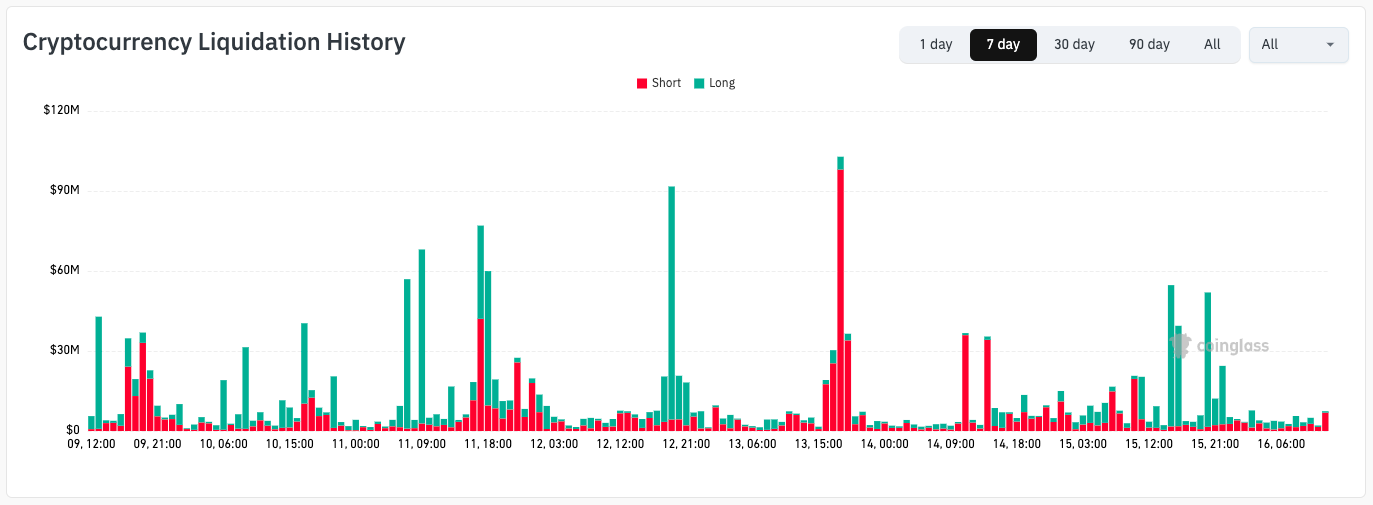
Crypto liquidations run high around $70,000 BTC
Despite the relative lack of BTC price volatility since the recovery from $59,000 lows, the market remains highly sensitive to even smaller moves.
This is reflected in elevated liquidations across crypto, with both long and short positions close to spot price being repeatedly erased.
Data from monitoring resource CoinGlass puts the total liquidation tally for the 24 hours to the time of writing at over $250 million. During that time, BTC/USD acted within a range of less than $3,000.
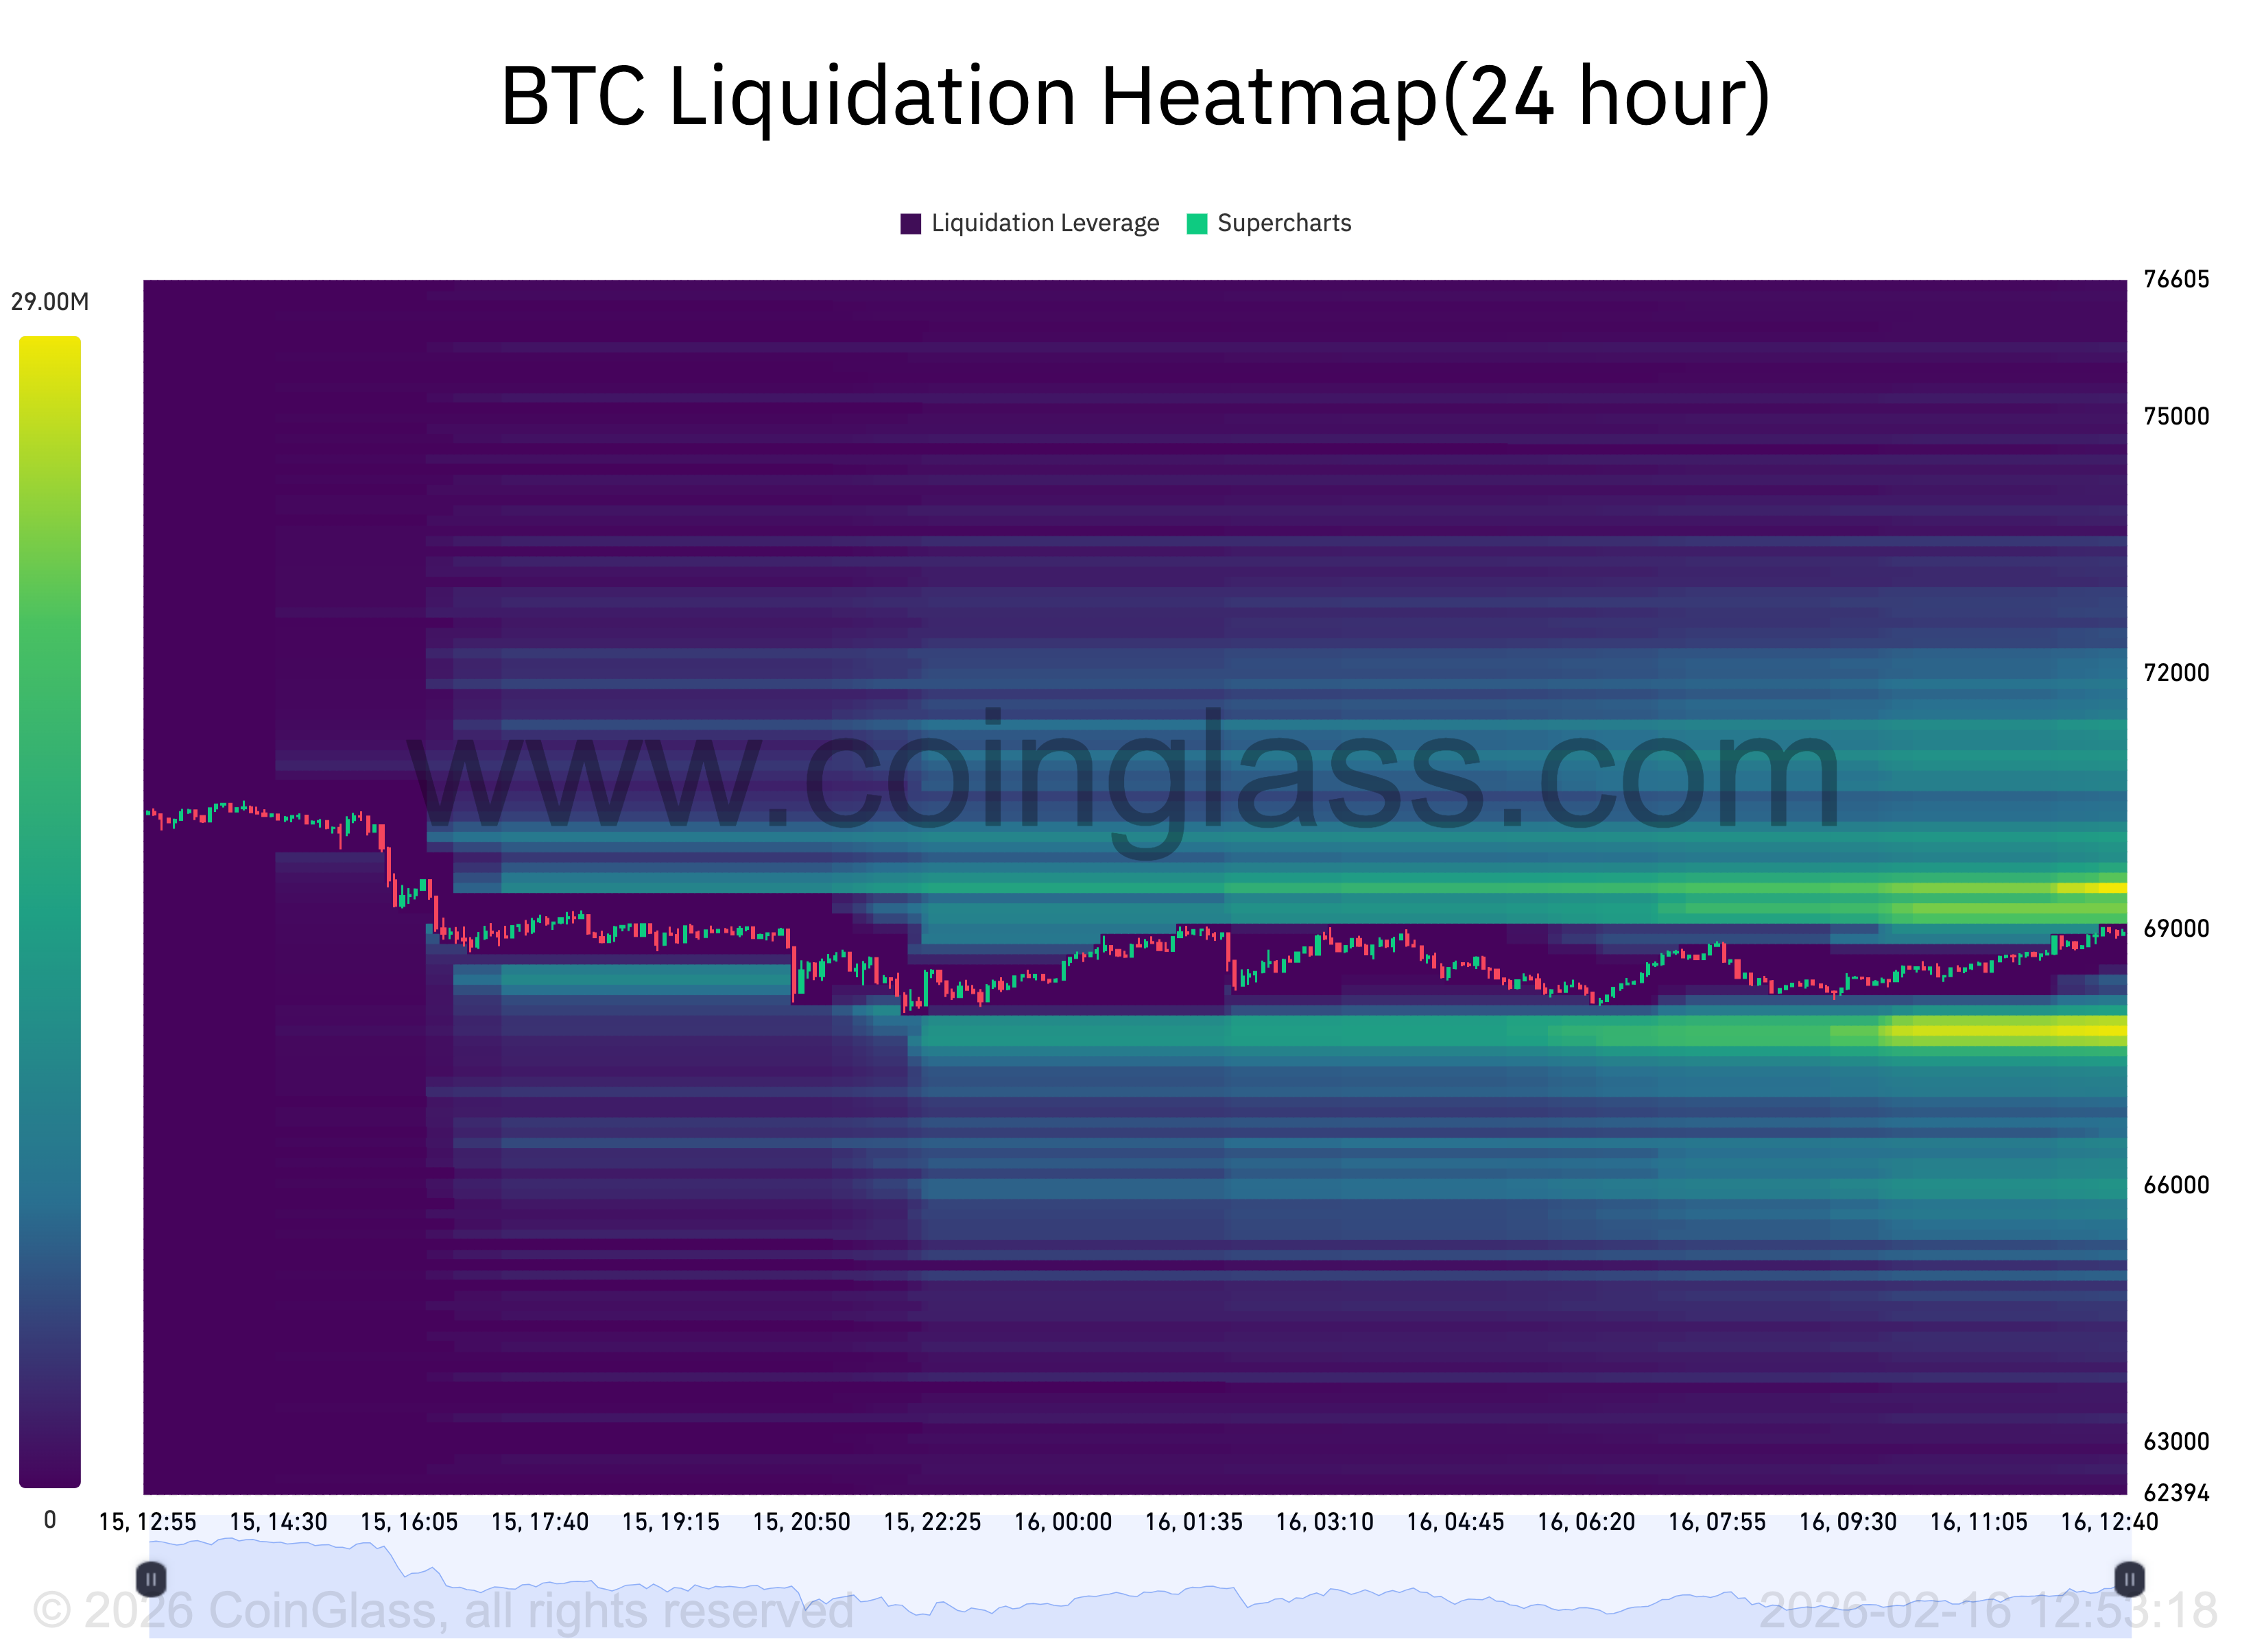
CoinGlass now shows traders doubling down on long BTC positions immediately below $68,000 as the week begins.
Commenting, trader CW said that these would now become the next target for whales.
CW had some potential good news for bulls, with longs still prevailing in the current market setup.
“Despite significant liquidation of $BTC long positions, longs remain dominant. Expectations for a bullish trend remain intact,” they told X followers.
On Friday, as BTC/USD spiked past $70,000 around the Wall Street open, short liquidations even beat recent records. At 10,700 BTC, the short liquidation tally reached its highest daily reading since September 2024.
“If spot demand follows, this squeeze could be the first sign the downside trend is running out of steam,” crypto exchange Bitfinex wrote in an X reaction.
PCE and GDP lead volatile macro week
With US markets closed for the Presidents’ Day holiday on Monday, key economic data — and any associated risk-asset volatility — will come later in the week.
Chief among the upcoming releases is the Personal Consumption Expenditures (PCE) Index, known as the Federal Reserve’s “preferred” inflation gauge. Q4 GDP data is due the same day, Friday.
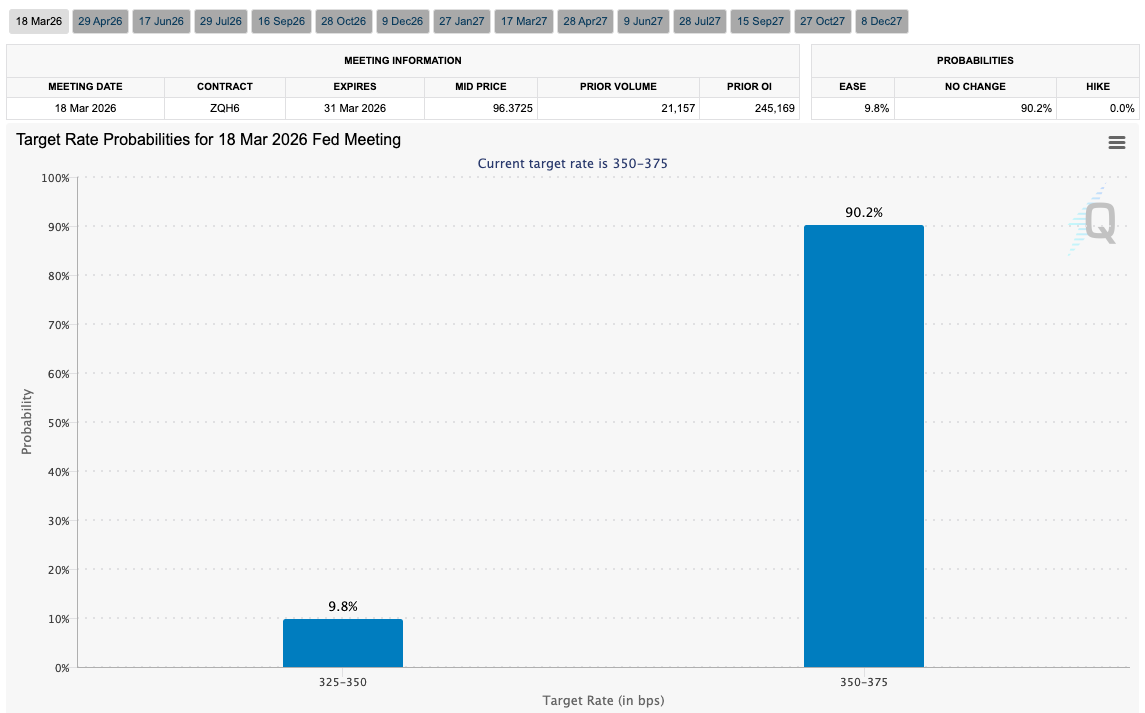
PCE is due out at a key moment for Fed policy — recent inflation numbers have given a mixed picture of economic conditions, leading to uncertainty in the markets. Expectations of the Fed returning to policy loosening at its March meeting remain low, despite last week’s Consumer Price Index (CPI) coming in below expectations.
According to CME Group’s FedWatch Tool, the odds that officials will hold interest rates at current levels next month remain over 90%.
“Expect more volatility this week,” trading resource The Kobeissi Letter told X followers while summarizing the upcoming macro events.
“Meanwhile, geopolitical tensions remain and macroeconomic uncertainty is elevated.”
In the latest edition of its regular newsletter, The Market Mosaic, analytics resource Mosaic Asset Company additionally focused on last week’s US employment report as a potential headache for the Fed.
“The report is clouding the outlook for further rate cuts by the Federal Reserve, with market-implied odds pointing to two quarter-point rate cuts later this year. However, the 2-year Treasury yield that leads changes in the fed funds rate is near the low end of the current fed funds range and suggests no cuts at all,” it noted.
Analysis puts spotlight on mid-$50,000 zone
In fresh market research issued on Monday, onchain analytics platform CryptoQuant said that future BTC price bottoms will increasingly rely on “investor resilience.”
Looking back at the first half of February, contributor GugaOnChain warned that a showdown could occur at the confluence of two key price points below $60,000.
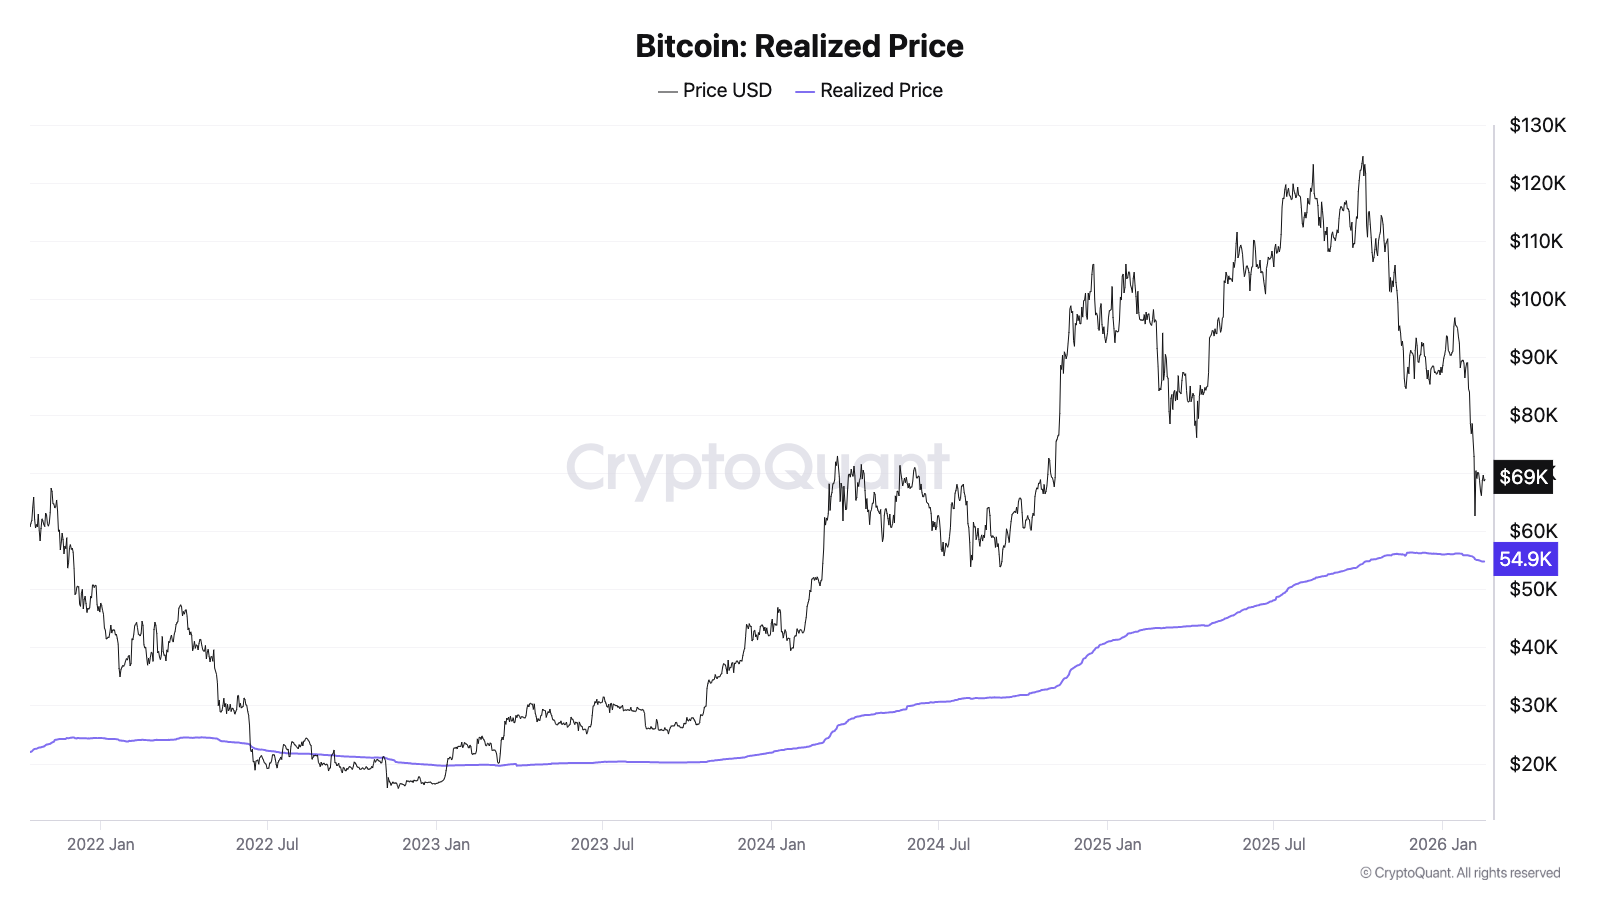
Here, Bitcoin’s 200-week simple moving average (SMA) meets its overall realized price — the aggregate level at which the supply last moved onchain.
“Bitcoin’s 50% collapse toward the 200-period moving average on the weekly timeframe — which converge with the region of its realized price at $55,800 — will be a significant test, besides being seen by analysts as a region conducive to accumulation,” GugaOnChain wrote in a Quicktake blog post.
“However, the turn toward recovery now depends on investor resilience.”
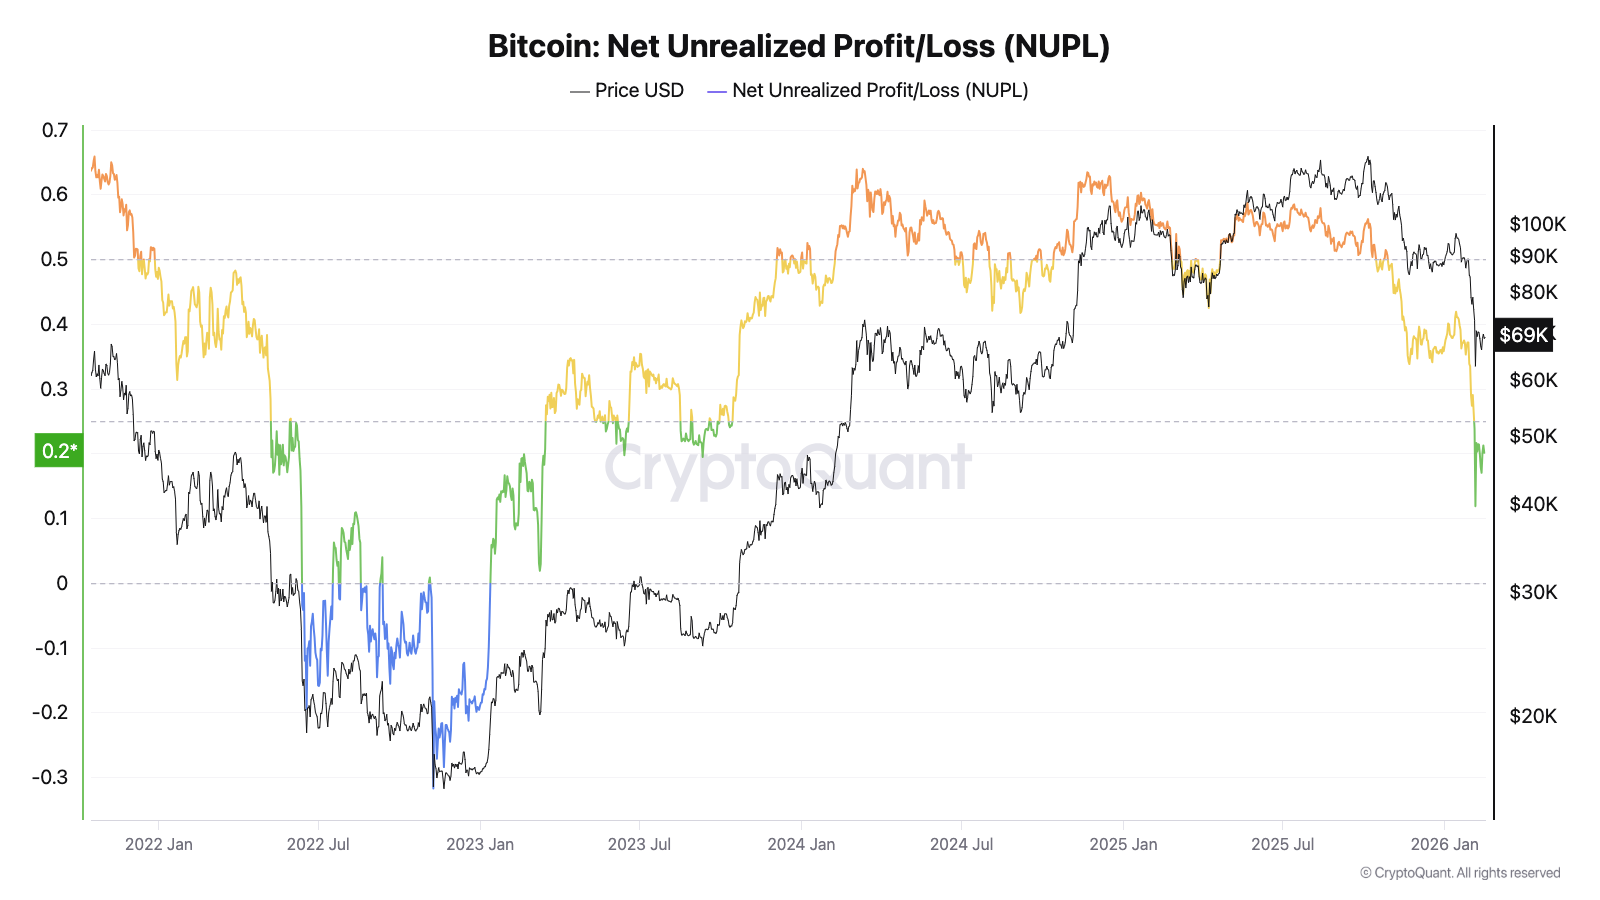
The research also pointed to comparatively low values on the net unrealized profit/loss (NUPL) indicator — a yardstick for overall BTC holdings’ profitability.
NUPL currently measures 0.201, having bounced from lows of 0.11 seen on Feb. 6. The latter reading represents the indicator’s lowest since March 2023.
GugaOnChain described NUPL as being “in the fear region.”
Bitcoin may still lack “real bottom”
Other onchain profitability data goes further, and warns that the current BTC price dip may be just the start of a “regime change.”
Related: Coinbase misses Q4 earnings, Ethereum eyes ‘V-shaped recovery’: Hodler’s Digest, Feb. 8 – 14
Here, CryptoQuant leveraged the adjusted spent output profit ratio (aSOPR) — a metric that measures the proportion of coins moving onchain at higher levels compared to their previous transaction.
aSOPR discards coins that moved more than once in a one-hour time frame, helping to remove “noise” from transactions that do not necessarily imply a loss for the holder.
On Feb. 6, the metric dropped below its breakeven level of 1, implying realized losses on a scale not seen since 2023 and the end of Bitcoin’s last bear market.
“In 2019 and 2023, similar readings occurred during deep corrective phases where coins were being spent at a loss,” contributor Woo Minkyu commented in another Quicktake post.
“Each time, this zone represented capitulation pressure and structural reset. Now, aSOPR is again pressing into that same region.”
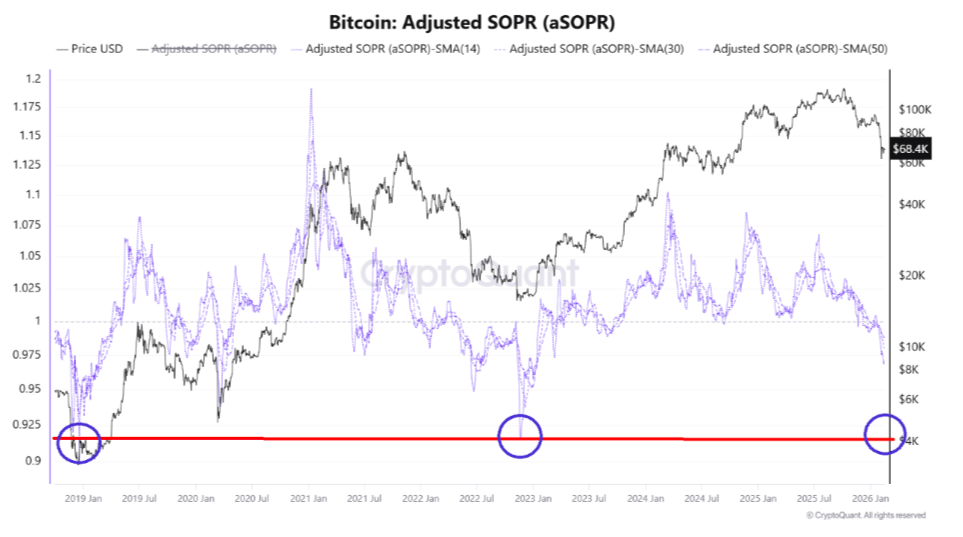
Woo described current market structure as one that “resembles prior bear transition phases.”
“Unlike mid-cycle pullbacks where aSOPR quickly reclaims 1.0, this move shows sustained weakness and loss realization. If aSOPR fails to reclaim 1.0 soon, this increases the probability that we are not in a simple correction — but transitioning into a broader bear phase,” he warned.
aSOPR currently measures 0.996, having managed only brief spikes above breakeven over the past month.
“aSOPR is signaling structural deterioration. This looks less like a dip, and more like a regime shift,” Woo concluded.
“The real bottom may still require deeper compression before a durable reversal forms.”
This article does not contain investment advice or recommendations. Every investment and trading move involves risk, and readers should conduct their own research when making a decision. While we strive to provide accurate and timely information, Cointelegraph does not guarantee the accuracy, completeness, or reliability of any information in this article. This article may contain forward-looking statements that are subject to risks and uncertainties. Cointelegraph will not be liable for any loss or damage arising from your reliance on this information.

