Even after the upswing mid-this week, Bitcoin prices remain wavy, considering price action in lower time frames. The coin is retesting $66,000 at spot rates, but traders expect the breakout to have been confirmed, pushing BTC prices toward $70,000.
Since the surge to all-time highs in March, the coin has been on a steady downtrend, as shown in the formation on the daily chart.
BTC Liquidity Is High Despite Accumulation: Analyst
Therefore, as doubt creeps in, Willy Woo, a Bitcoin on-chain analyst, is calming down market participants, saying the coin is preparing for sharp gains in the days ahead.
Related Reading
Though prices are flat-lining in the daily chart, what’s important to note, Woo says, is the level of liquidity.
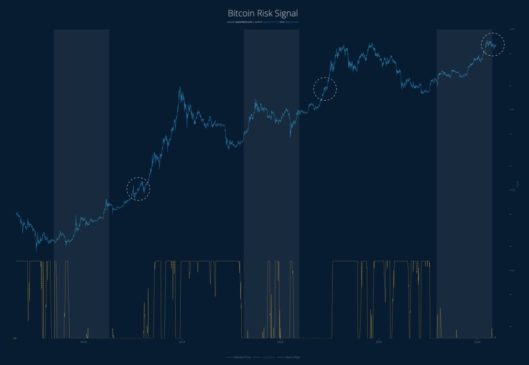
Sharing a chart on X, Woo emphasized Bitcoin’s position within its liquidity cycle. The Bitcoin liquidity cycle is simply a chart showing the boom and bust periods of the world’s most valuable coin. Every cycle in history is highly influenced by the availability and flow of capital in and out of the asset.
The analyst is upbeat, arguing that though prices are down from all-time highs and appear stuck in a consolidation, the coin is still in a “warm-up” phase. Woo adds that the current consolidation period means the long-term risk is low in light of the relatively high liquidity.
Comparing the current state of affairs to past price action, the analyst predicts that Bitcoin prices will likely surge. When “the floodgates open” and new capital enters the market, prices will shoot higher, but so will risk.
Bitcoin Uptrend Just Getting Started?
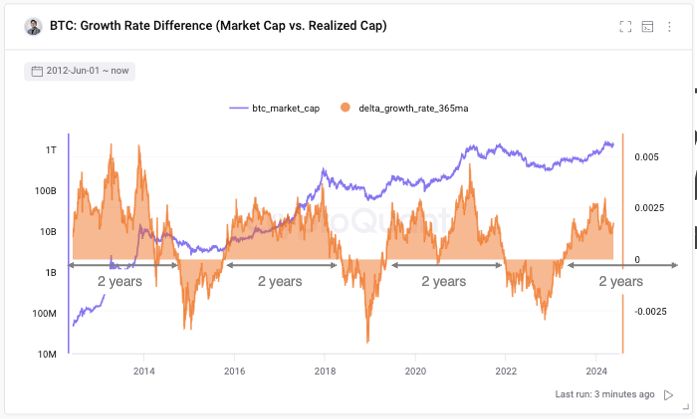
Ki Young Ju, the founder of CryptoQuant, a crypto analytics platform, has supported Woo’s position. To X, Ju said Bitcoin is in the middle of a bull cycle.

To explain this view, the founder noted that Bitcoin’s capitalization has been growing faster than the realized cap. The realized cap is a metric that aims to gauge the total value of all coins in circulation based on the price at which they were last moved.
This trend has persisted for roughly two years historically. If this pattern holds, the bull cycle could end by April 2025.
Related Reading
Amid this, interest in spot Bitcoin exchange-traded funds (ETFs) appears to be swelling. An ETF analyst, Eric Balchunas, said these derivative products have attracted a net inflow of over $1.3 billion in the last two weeks alone. This uptick effectively offset the negative flows seen in April.
Feature image from DALLE, chart from TradingView


