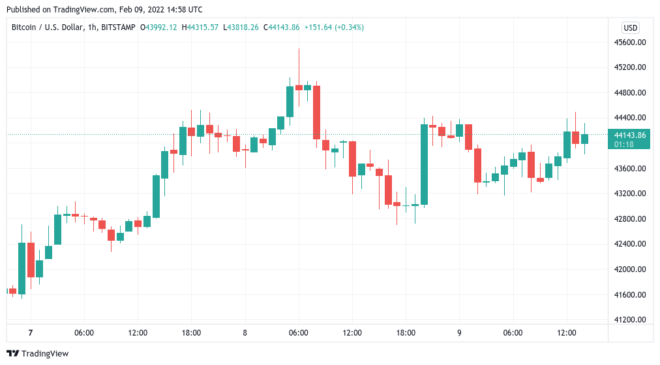
Bitcoin (BTC) hovered around $44,000 on Feb. 9 as a modest uptick towards the Wall Street open provided relief for support levels.
Melt-up or breakdown?
Data from Cryptox Markets Pro and TradingView showed BTC/USD acting in the range defined in recent days without significant downside pressure.
Circling $44,000, traders were mostly preoccupied with a potential retracement, this having the potential to wipe out practically all recent progress.
“Now that we are at monthly resistance we may see a pullback. Even if we do, a higher low to 38K–40K would be “healthy” followed by continuation to 50K+ and a reclamation of our monthly resistance after which point, I’ll have my sights set on a new ATH,” Credible Crypto argued on Twitter.
The long-term picture differed considerably, depending on the source and interpretation of macro market phenomena. While some called for a “melt-up” in stocks that would likewise aid BTC, others were far from convinced that 2022 would be an easy ride.
Has #Bitcoin Bottomed? It Looks Unlikely If #StockMarket Hasn’t – Most assets in 2022 face strong deflationary forces from the excesses of 2021, but Bitcoin appears well poised to come out ahead as it matures to the status of global digital collateral and shows divergent strength pic.twitter.com/oI7dhRvq1i
— Mike McGlone (@mikemcglone11) February 9, 2022
A contrasting theory reasoned that with short sellers shaken out, there would now be less pressure to drive BTC/USD down to take liquidity.
“The biggest question is: How much more pain can we inflict? All the liquidity’s taken from Short Term Holders, there’s no sell pressure. Market’s had a full healthy reset, while maintaining a bullish structure on the large time frames,” Twitter account Crypto5max summarized.
MACD delivers classic bull signal
In a separate development, Feb. 9 saw the return of a classic bullish chart signal, which has got one analyst particularly excited.
Related: Bitcoin needs to reclaim these two levels to avoid another dip to $28K
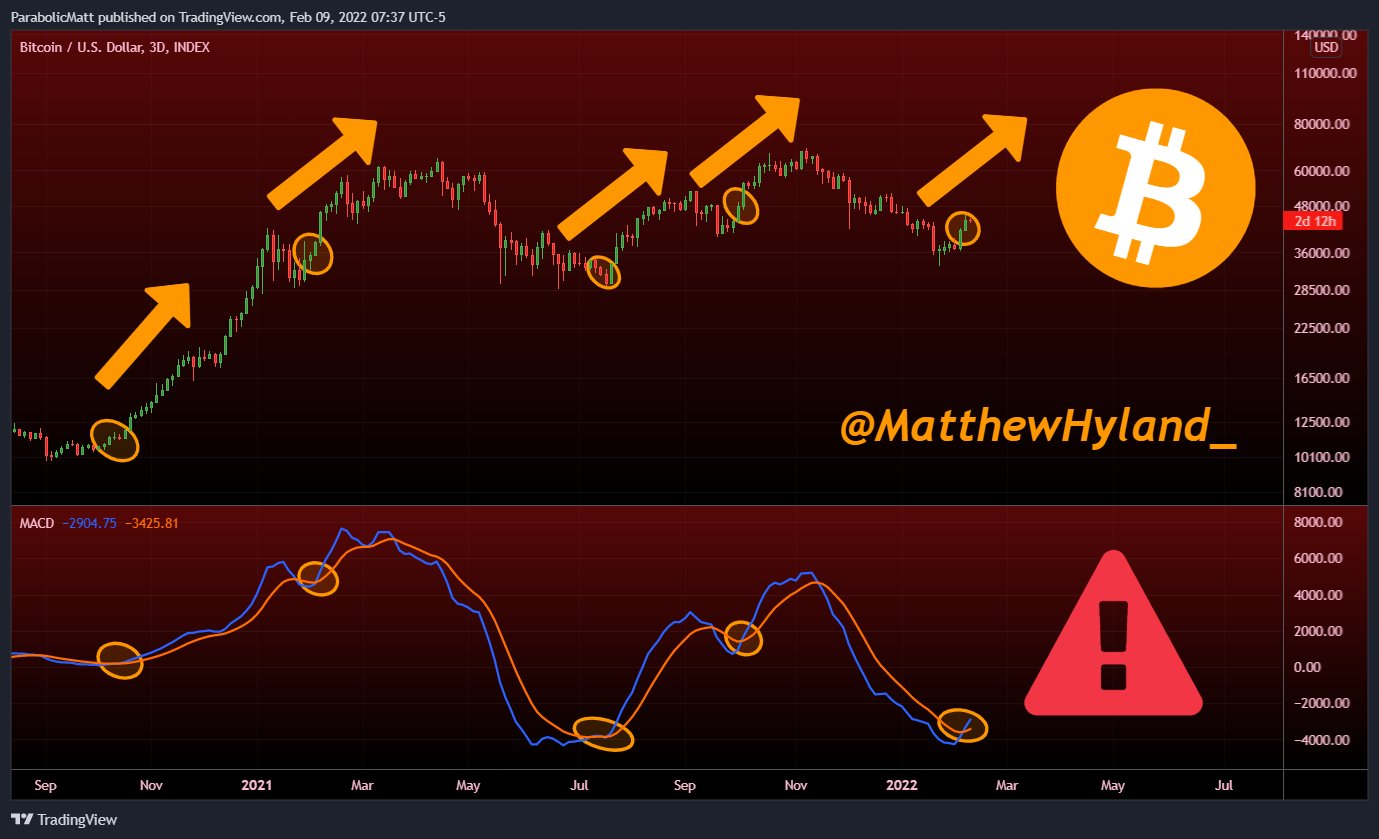
Bitcoin’s moving average convergence/ divergence (MACD), a key frontrunner of bullish phases in 2021 and prior, printed a fresh key crossover this week.
For Matthew Hyland, the implications of the event are clear, based on historical patterns.
“I have been waiting and updating this key reversal indicator to cross for nearly a month and it has finally happened,” he commented alongside a chart showing the MACD signal’s previous impact on BTC price action.
As Cryptox reported, Bitcoin’s relative strength index (RSI) likewise flashed green last week, breaking out of a downtrend in place since November’s all-time highs.


