
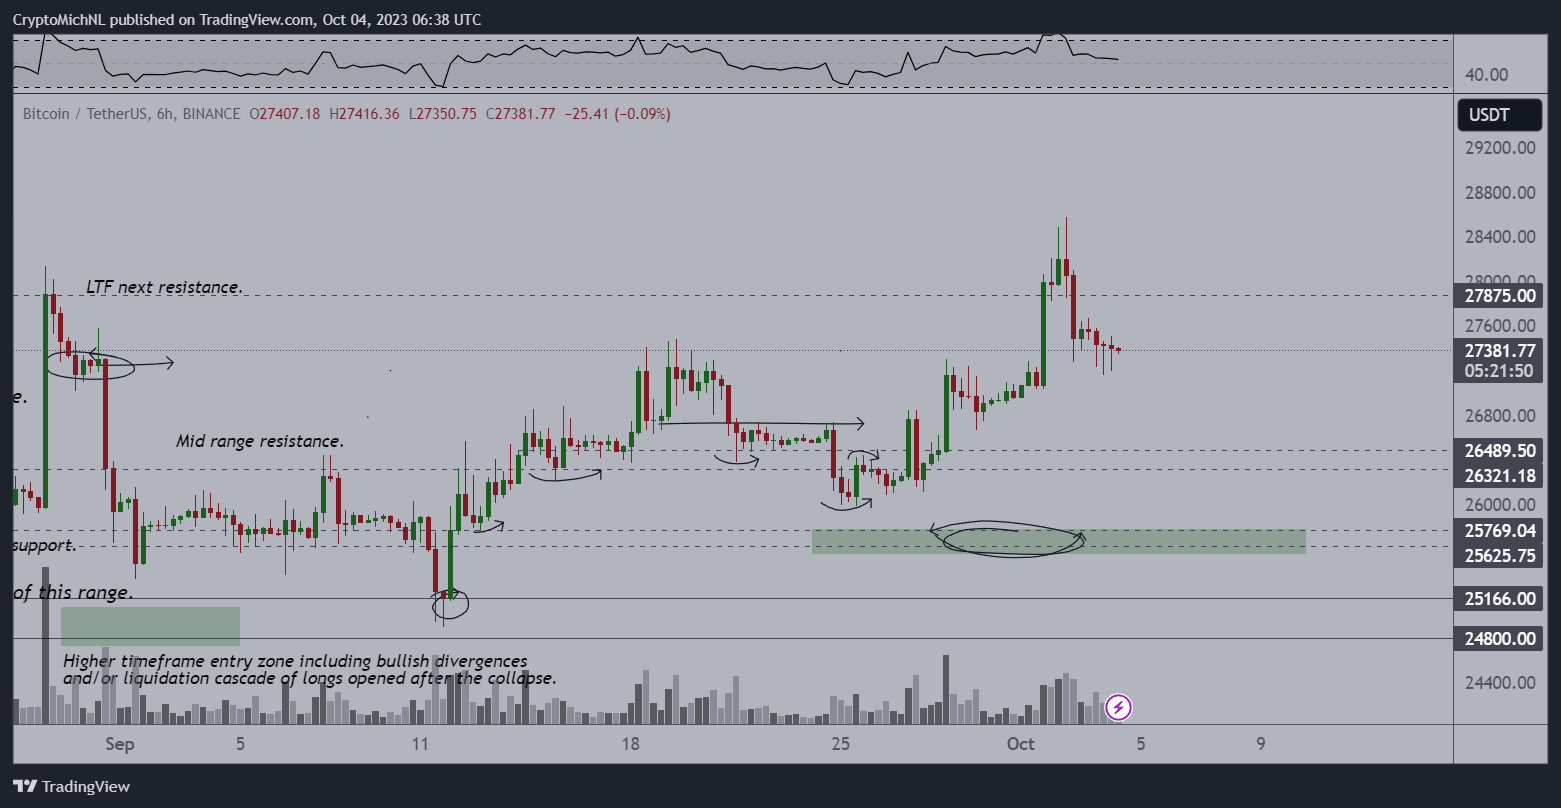
Bitcoin (BTC) rejected at $28,000 after the Oct. 5 Wall Street open as a return toward six-week highs failed.
Bitcoin sees swift comedown after new $28,000 retest
Data from Cointelegraph Markets Pro and TradingView followed BTC price action as bulls attempted to match levels from earlier in the week.
This encountered problems just above the $28,000 mark, however, with the subsequent hourly candle sending the market down up to $700, or 2.5%.
Commenting on the status quo, on-chain monitoring resource Material Indicators was unsurprised. Its proprietary trading tools had warned of a fresh downturn, it said, and the chain of events could still repeat.
“If you didn’t see this rejection coming, then you might want to evaluate your tools, because both TA and Trend Precognition indicated a high probability of a rejection,” part of an X post stated.
“That doesn’t mean we won’t see another attempt, because we probably will.”
Continuing, Material Indicators co-founder Keith Alan eyed a possible trading range for BTC/USD going forward, noting that the current spot price zone was the site of “key” support/resistance flips in prior bull markets.
“So far, Key Moving Averages are serving as strong technical resistance (and support). Breaking this range to the upside is a possibility this month. If it happens, a lot of people are going to get rekt along the way,” he told X subscribers.
“A close above the 200-Week MA would fuel bullish hopium. A close below the 21-Week MA keeps BTC ranging between $25k – $28k until something breaks.”
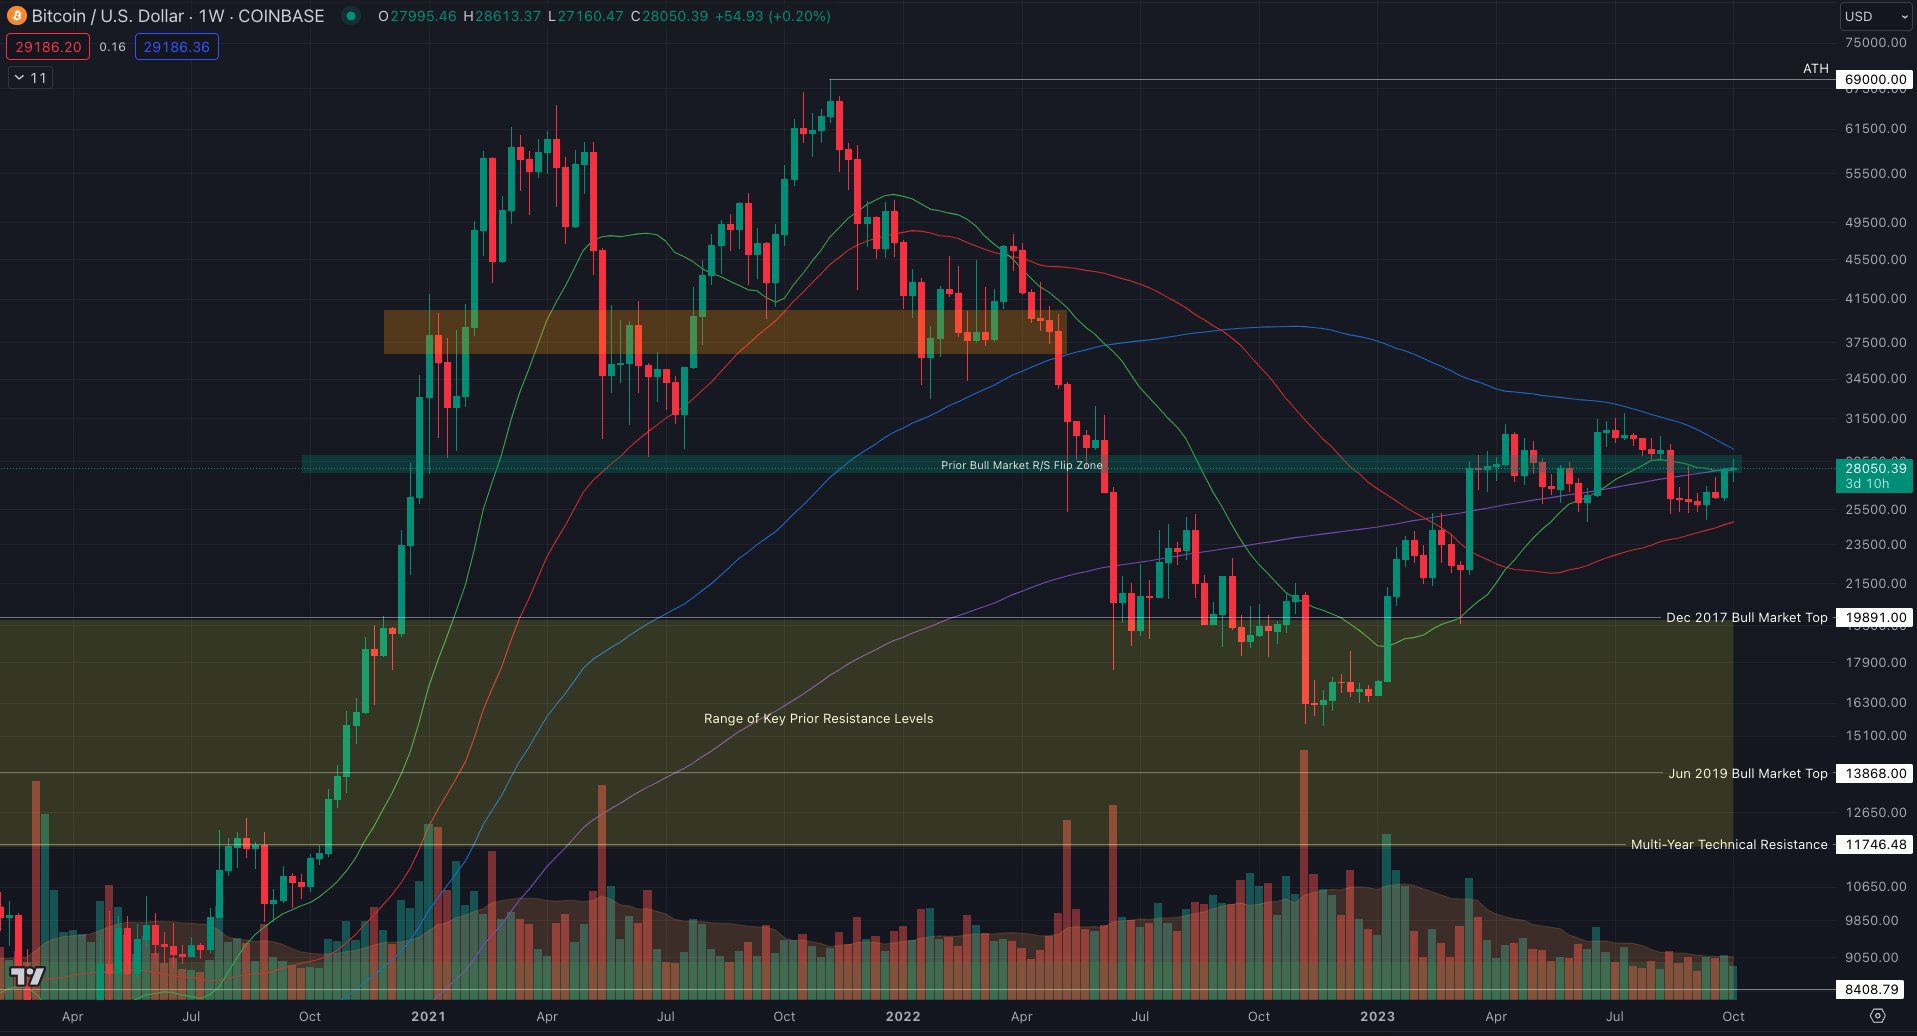
At the time of writing, the 200-week and 21-week MA stood at $27,970 and $27,868, respectively.
Others were more optimistic, with Michaël van de Poppe, founder and CEO of trading firm MN Trading, describing Bitcoin as “very much ready” to tackle $30,000 resistance.
“Few levels of importance for Bitcoin here,” he wrote in X analysis the day prior.
“Holding above $27,200 would be substantial for upwards continuation, but preferably is a retest at $26,700-26,900 before we’ll continue the rally to $30,000. Sentiment flipped quite fast.”
Trader taps RSI for BTC price bottom
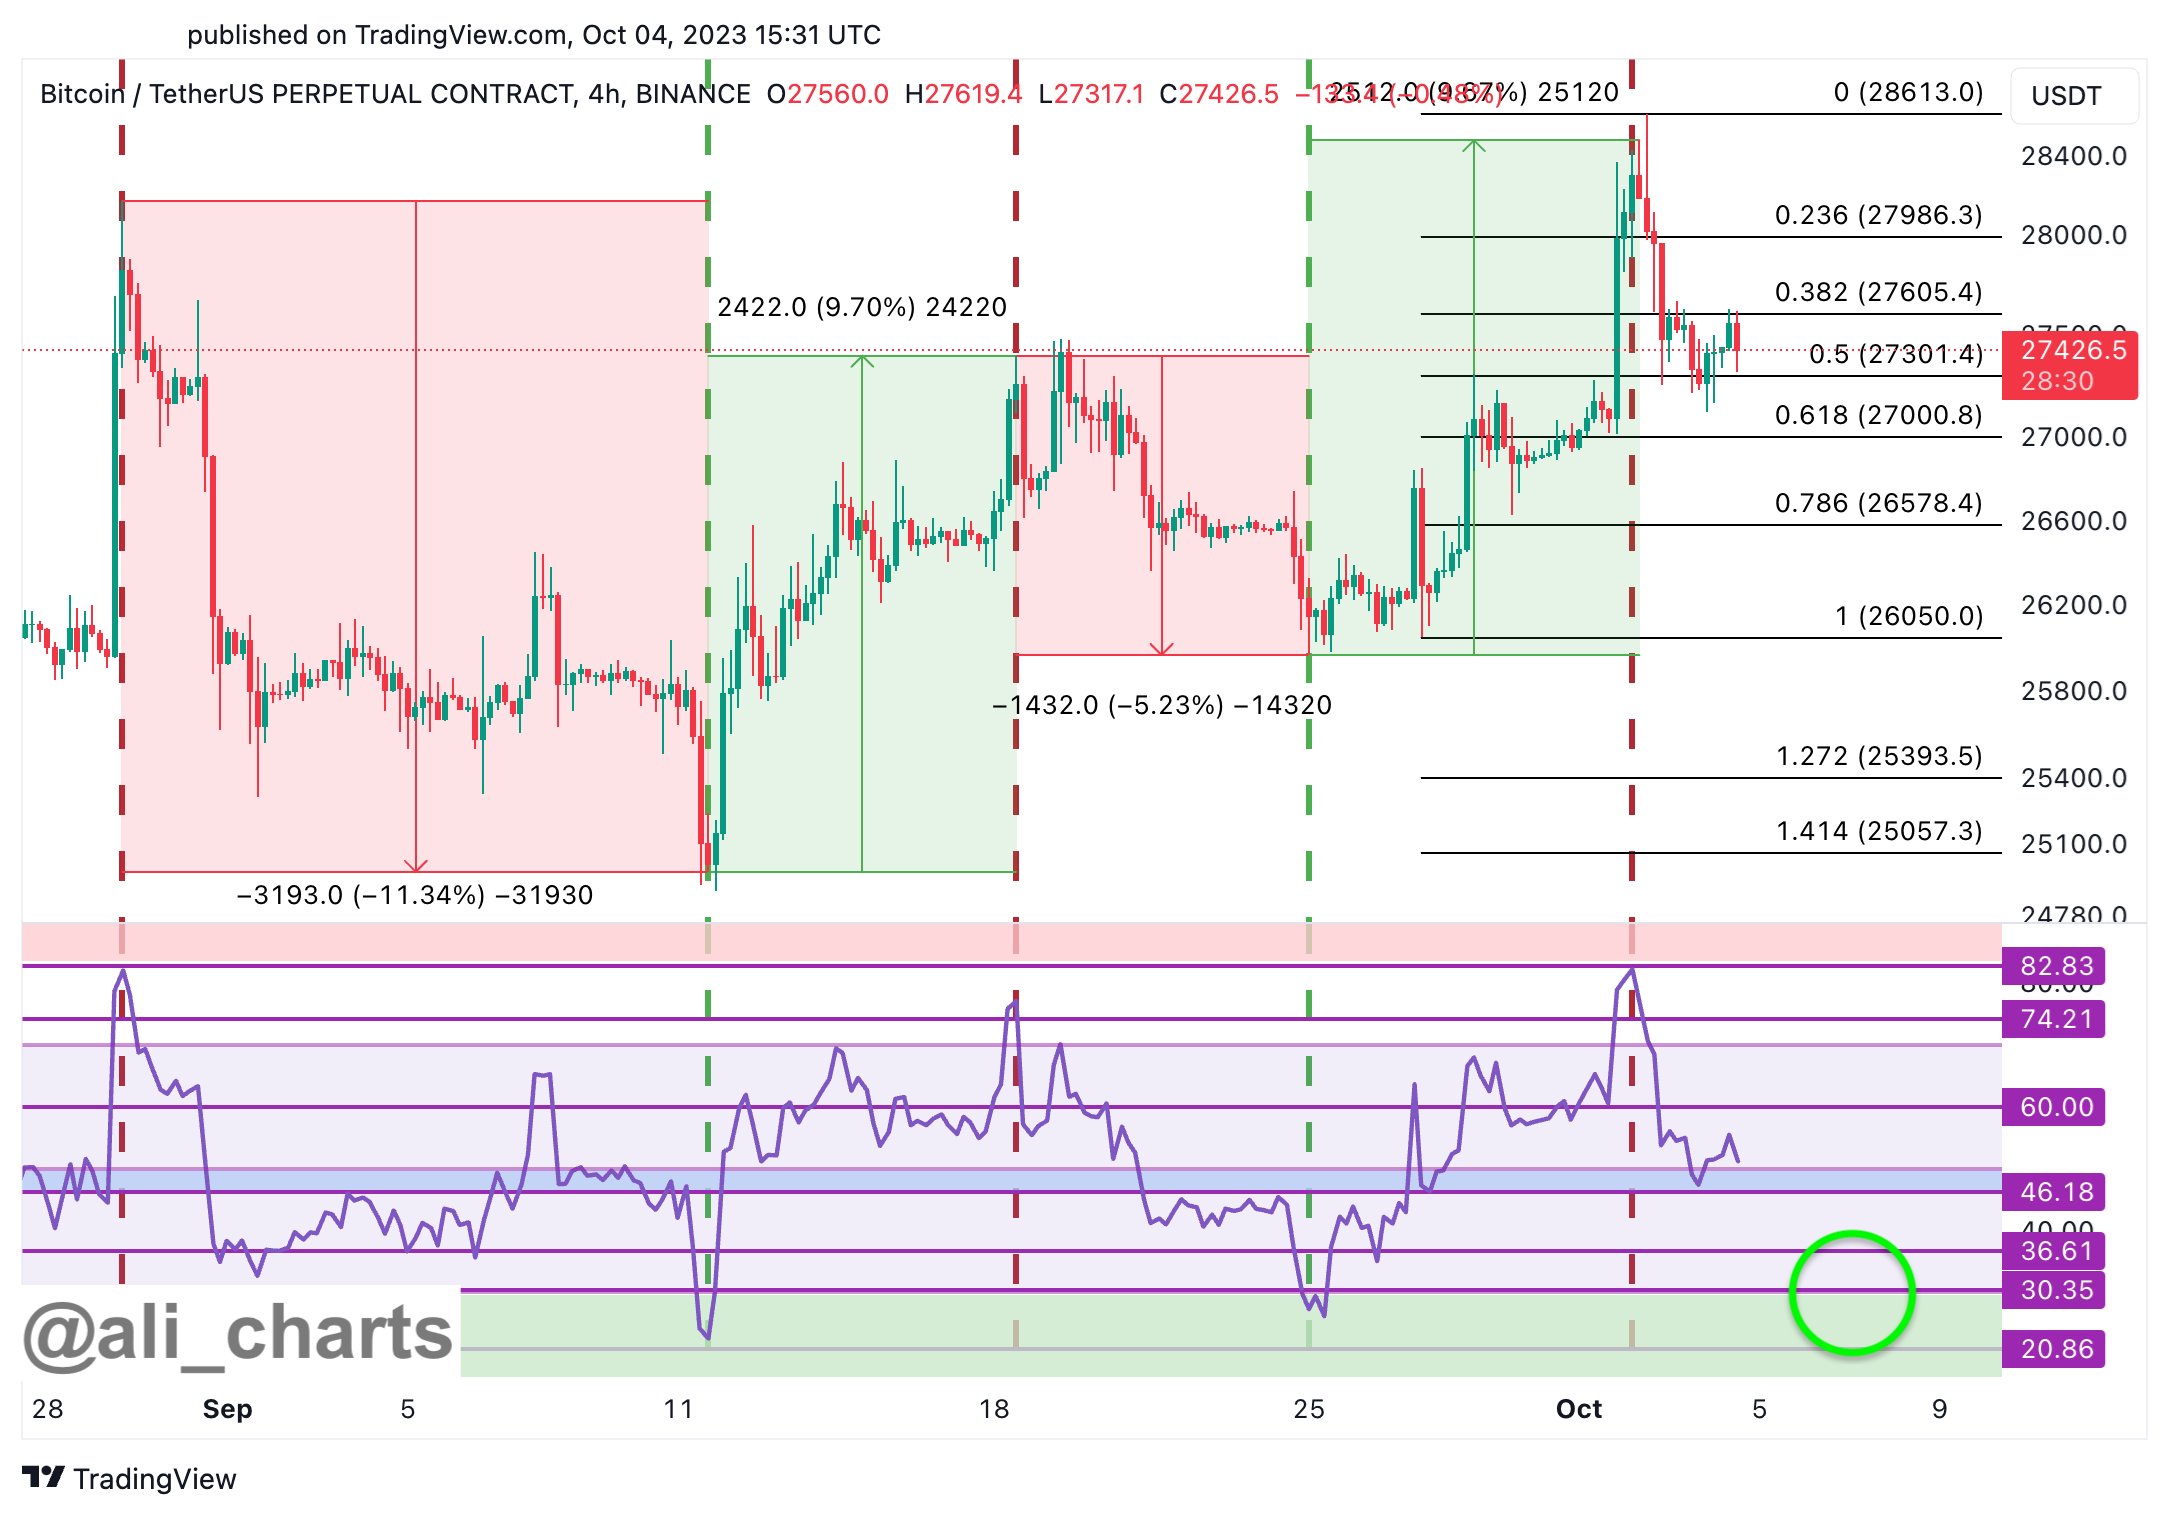
Elsewhere, popular trader and X commentator Ali revealed a BTC price trading method which he argued had tracked recent local tops and bottoms.
Related: Bitcoin still beating US dollar versus ‘eggflation’ — Fed data
This revolved around the relative strength index (RSI), which on four-hour timeframes had fluctuated between approximately 30 and 75 since late August.
“Currently, the RSI stands at 51. Patience is key! We might be best waiting for the RSI to drop below 30.35 to buy the dip!,” part of accompanying commentary advised.
Ali uploaded a chart showing a classic “sell” signal coming at the start of October, implying a new “buy” signal could come next — alongside a BTC price local low.
This article does not contain investment advice or recommendations. Every investment and trading move involves risk, and readers should conduct their own research when making a decision.


