
Bitcoin (BTC) hit $29,000 on June 21 as largescale buying fueled a fresh sentiment boost.
Analyst: $29,000 becoming fakeout “very unlikely”
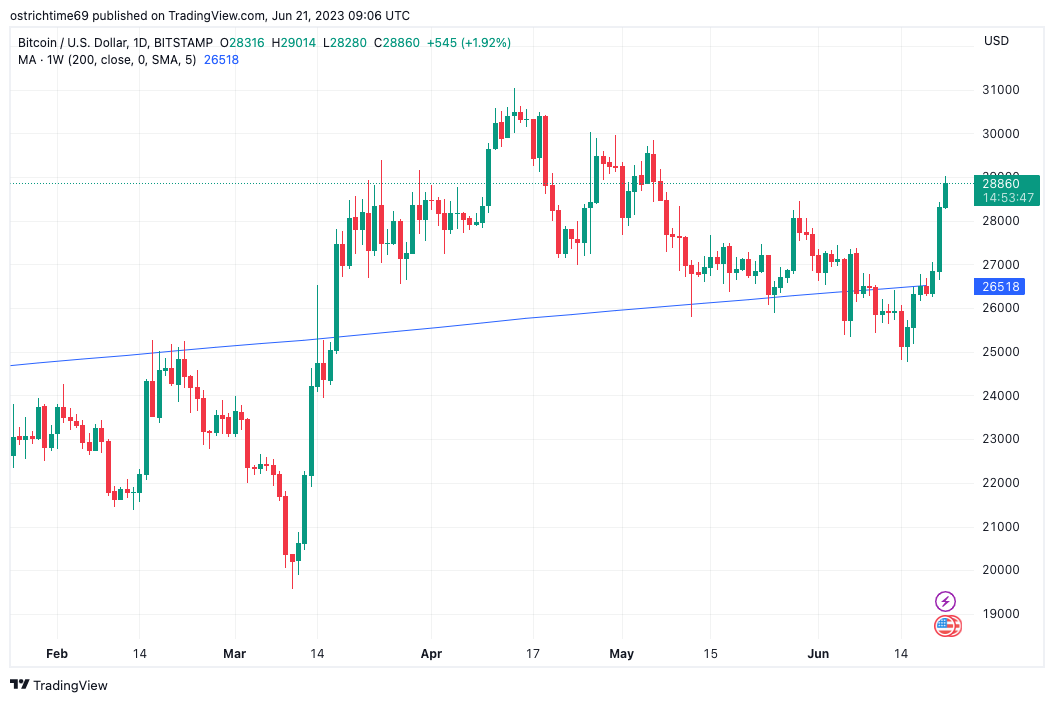
Data from Cointelegraph Markets Pro and TradingView showed BTC/USD reaching $29,014 on Bitstamp — its highest since May 7.
The pair enjoyed continued buyer interest overnight, this coming on the back of multiple announcements concerning new Bitcoin-focused institutional investment products.
This is not a short squeeze, but someone(s) is just buying $BTC a lot.
I repeat.
This is not a short squeeze, but someone(s) is just buying $BTC a lot.https://t.co/gkt9JiizM3 https://t.co/46KZRb0AMS pic.twitter.com/mPZzN317A8
— Ki Young Ju (@ki_young_ju) June 21, 2023
For analysts, who were previously concerned about overall market strength, the latest action was cause for a modest rethink.
“Fantastic BTC breakout beyond the multi-month downtrend,” popular trader and analyst Rekt Capital reacted.
“Very unlikely this will end up as an upside wick like in previous months.”
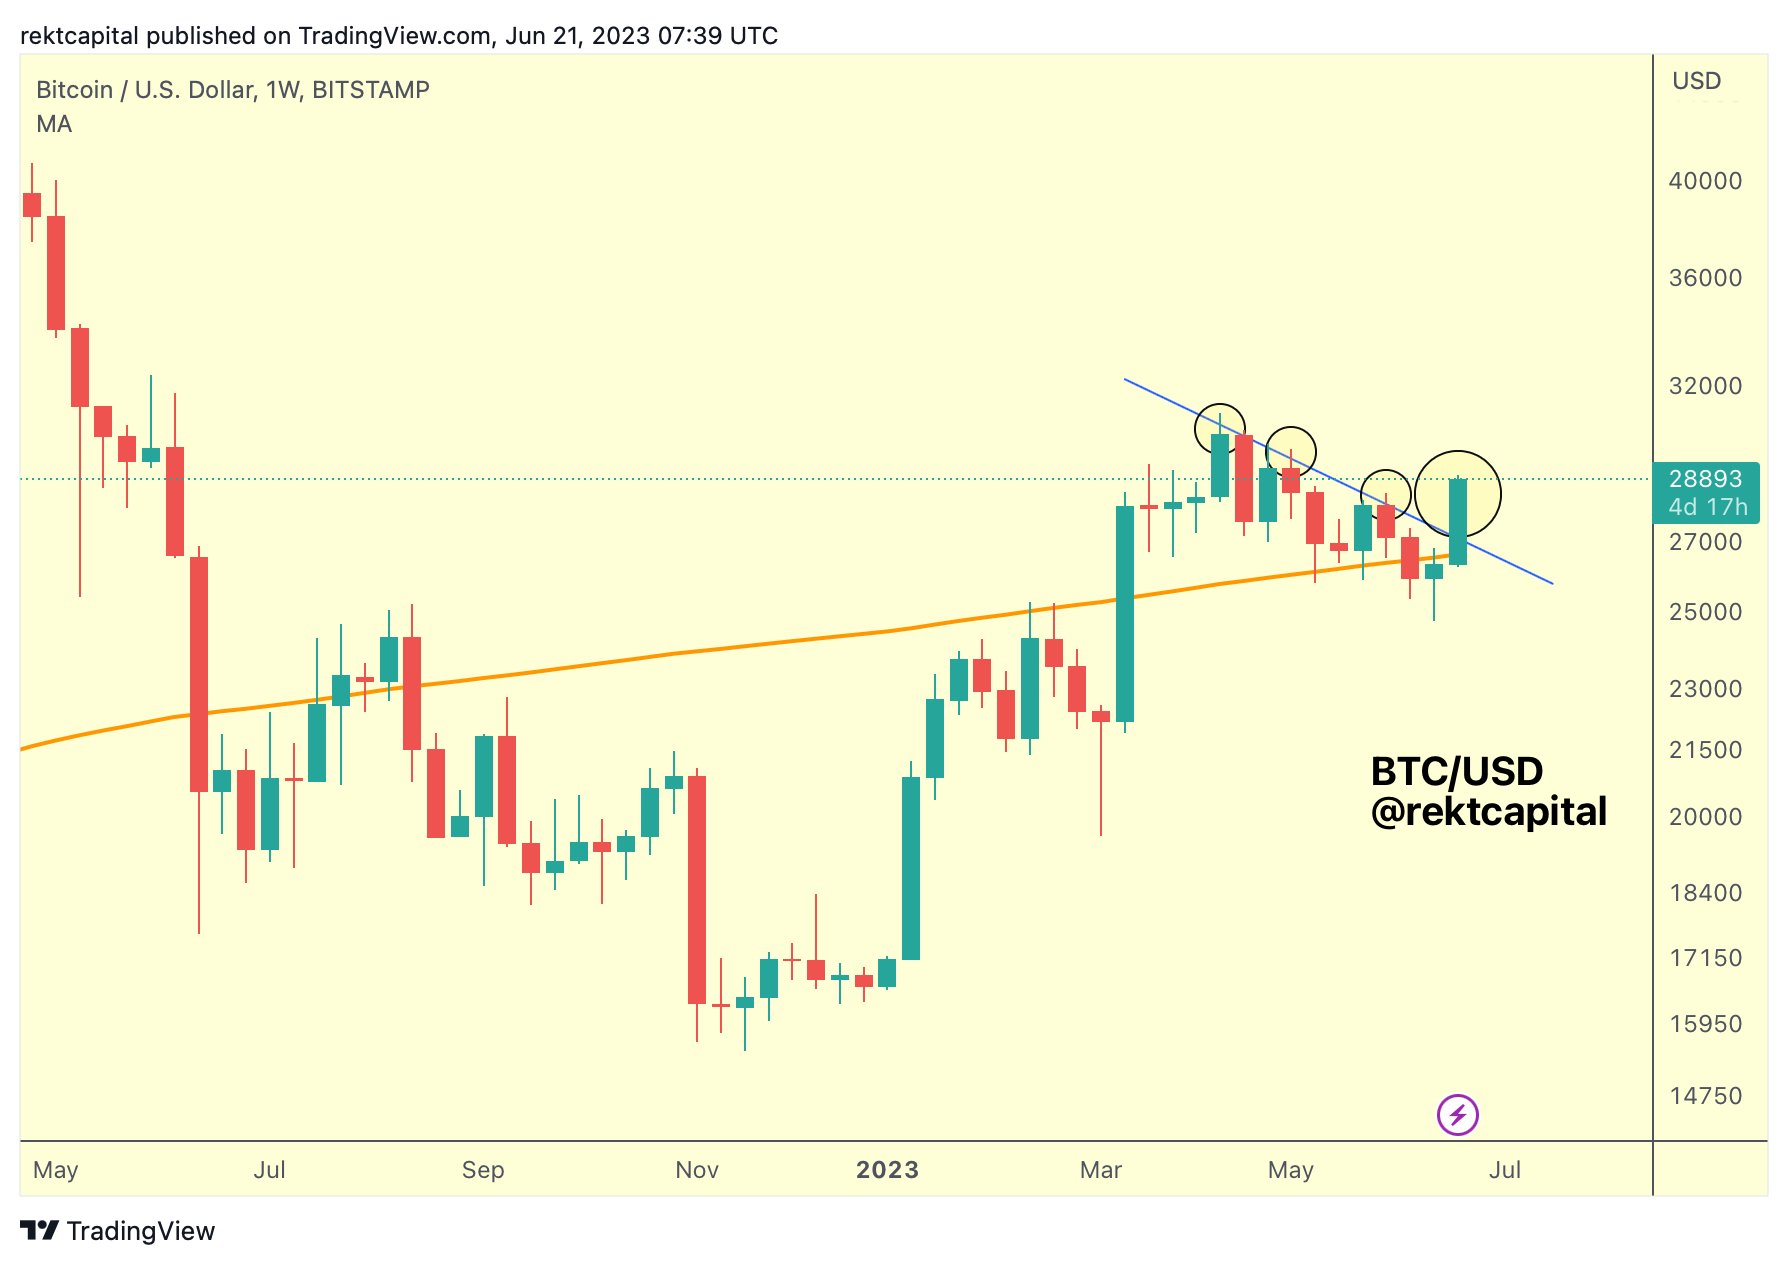
The day prior, with upside already in motion, Rekt Capital had nonetheless cautioned that the weekly candle close was necessary in order to confirm a substantial trend change.
“A BTC Weekly Candle Close beyond the multi-month downtrend would be a great breakout confirmation. That said, a $BTC dip into the downtrend for a successful retest would offer full confirmation of breakout,” he now added.
“The retest area is ~$26800.”
Fellow trader Crypto Tony meanwhile continued that Bitcoin could hit his upside target “earlier than anticipated.“
“As i said, if we did not lose the support zone on Bitcoin at $25,000, then there is no bearish control just yet,” he reasoned.
“Soon as we saw the bulls step in, that was our cue to long. Plan and Execute.”
Others were more conservative, with both Daan Crypto Trades and Michaël van de Poppe, founder and CEO of trading firm Eight, revealing closed long positions at the $29,000 mark.
Van de Poppe had nonetheless stated that BTC/USD was now on its way to $38,000 or higher.
Short-term holder support proves itself
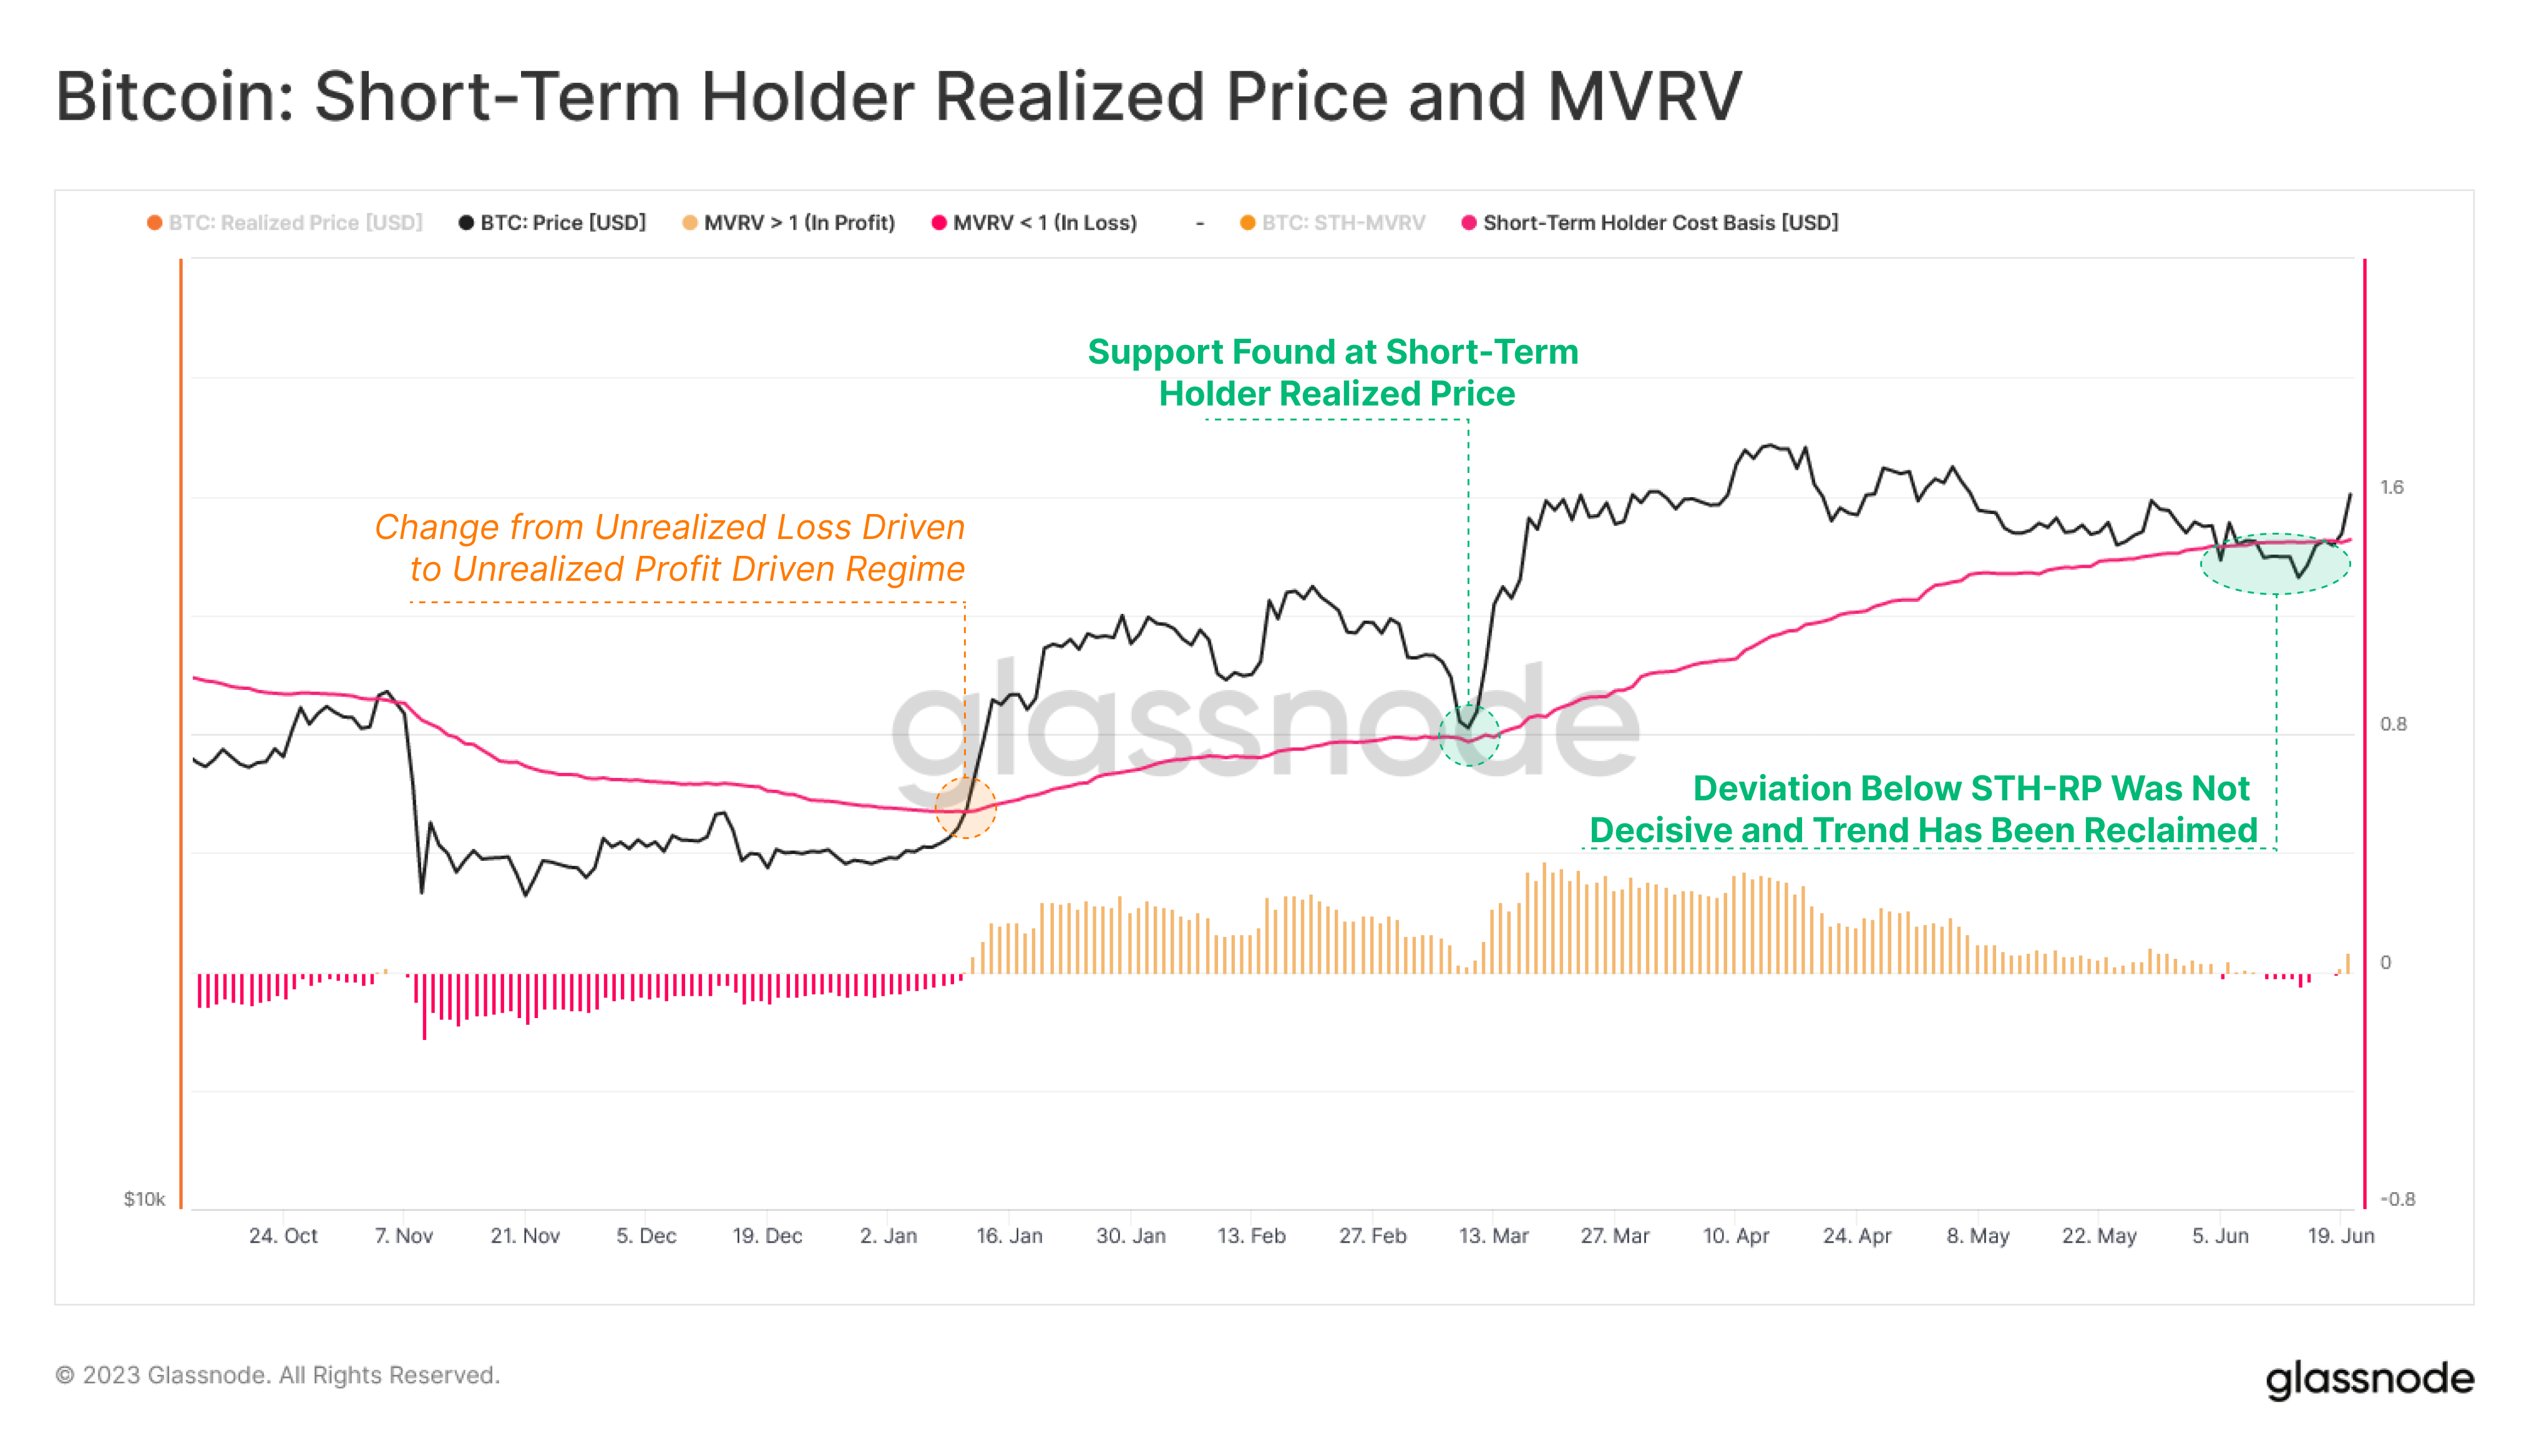
Regarding support levels, on-chain analytics firm Glassnode took the opportunity to underscore the significance of the short-term holder (STH) cost basis.
Related: Bitcoin price ‘sideways boredom’ may last 18 months — New research
At $26,400, the STH cost basis was now a formidable line in the sand, which BTC/USD rebounding strongly after placing STHs in unrealized loss territory.
“26,550 remains a significant baseline in determining market trend,” Glassnode tweeted, referring to previous research covered by Cointelegraph.
“The recent deviation below the STH-CB was not decisive, culminating in a reclamation of the prevailing uptrend.”
The 200-week moving average, another key bear market support line, currently also lies near the mid-$26,000 zone.
Magazine: Bitcoin is on a collision course with ‘Net Zero’ promises
This article does not contain investment advice or recommendations. Every investment and trading move involves risk, and readers should conduct their own research when making a decision.


